Immigrants from Bosnia and Herzegovina vs Immigrants from St. Vincent and the Grenadines Master's Degree
COMPARE
Immigrants from Bosnia and Herzegovina
Immigrants from St. Vincent and the Grenadines
Master's Degree
Master's Degree Comparison
Immigrants from Bosnia and Herzegovina
Immigrants from St. Vincent and the Grenadines
14.3%
MASTER'S DEGREE
22.0/ 100
METRIC RATING
207th/ 347
METRIC RANK
13.9%
MASTER'S DEGREE
11.0/ 100
METRIC RATING
226th/ 347
METRIC RANK
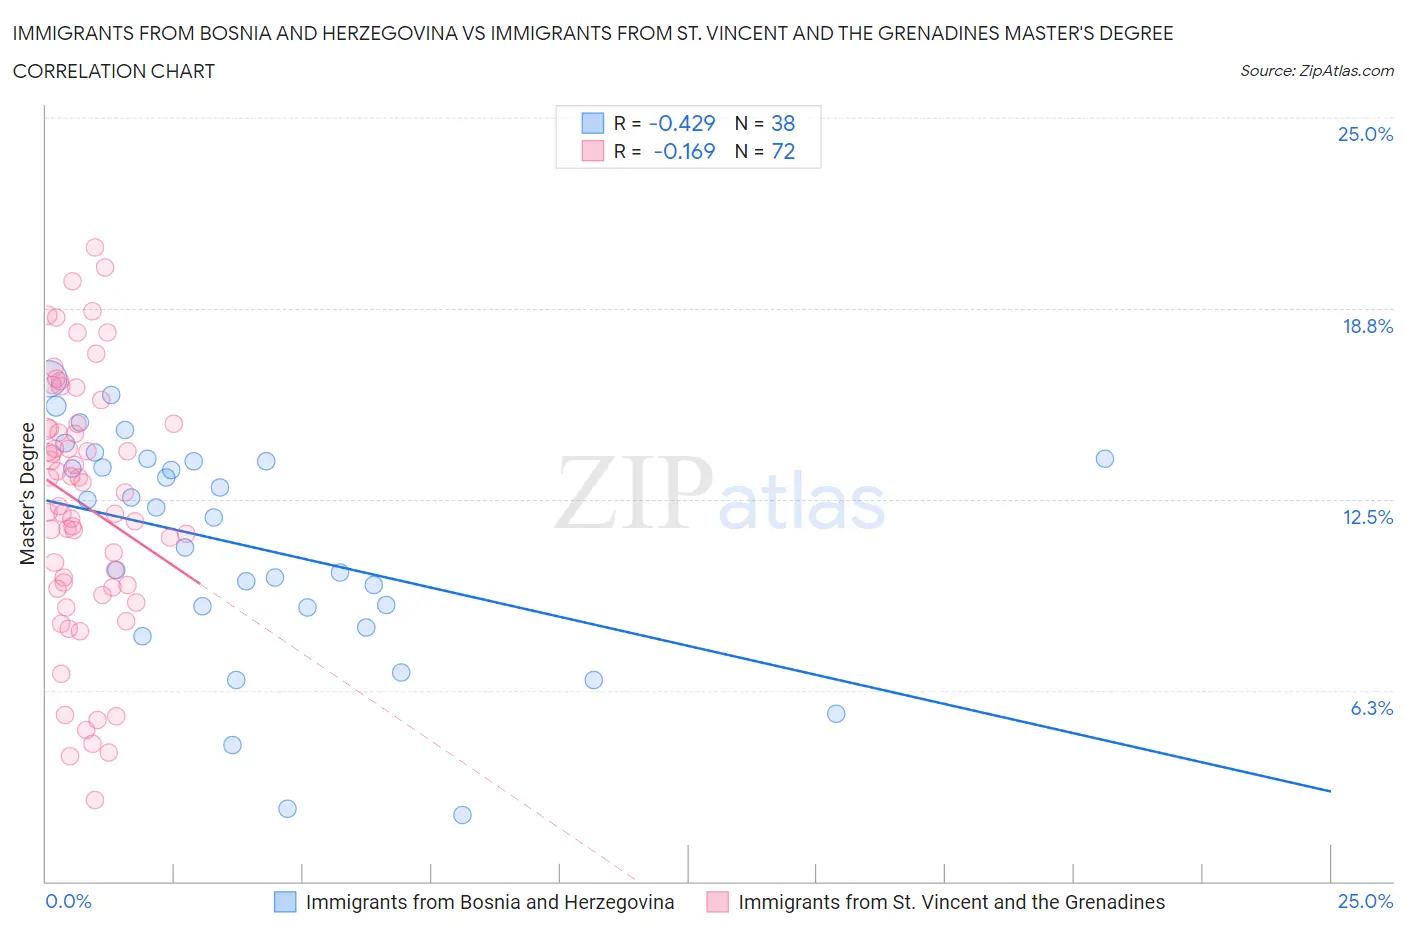
Immigrants from Bosnia and Herzegovina vs Immigrants from St. Vincent and the Grenadines Master's Degree Correlation Chart
The statistical analysis conducted on geographies consisting of 156,790,700 people shows a moderate negative correlation between the proportion of Immigrants from Bosnia and Herzegovina and percentage of population with at least master's degree education in the United States with a correlation coefficient (R) of -0.429 and weighted average of 14.3%. Similarly, the statistical analysis conducted on geographies consisting of 56,186,980 people shows a poor negative correlation between the proportion of Immigrants from St. Vincent and the Grenadines and percentage of population with at least master's degree education in the United States with a correlation coefficient (R) of -0.169 and weighted average of 13.9%, a difference of 2.8%.
Master's Degree Correlation Summary
| Measurement | Immigrants from Bosnia and Herzegovina | Immigrants from St. Vincent and the Grenadines |
| Minimum | 2.2% | 2.6% |
| Maximum | 16.4% | 20.8% |
| Range | 14.3% | 18.1% |
| Mean | 10.9% | 12.3% |
| Median | 12.1% | 12.5% |
| Interquartile 25% (IQ1) | 9.0% | 9.6% |
| Interquartile 75% (IQ3) | 13.8% | 14.9% |
| Interquartile Range (IQR) | 4.8% | 5.3% |
| Standard Deviation (Sample) | 3.7% | 4.2% |
| Standard Deviation (Population) | 3.6% | 4.1% |
Demographics Similar to Immigrants from Bosnia and Herzegovina and Immigrants from St. Vincent and the Grenadines by Master's Degree
In terms of master's degree, the demographic groups most similar to Immigrants from Bosnia and Herzegovina are Scandinavian (14.4%, a difference of 0.25%), Immigrants from Barbados (14.3%, a difference of 0.30%), Immigrants from Panama (14.3%, a difference of 0.39%), Subsaharan African (14.2%, a difference of 0.52%), and Somali (14.2%, a difference of 0.84%). Similarly, the demographic groups most similar to Immigrants from St. Vincent and the Grenadines are Portuguese (13.9%, a difference of 0.050%), Immigrants from Grenada (14.0%, a difference of 0.26%), Immigrants from South Eastern Asia (14.0%, a difference of 0.31%), Ecuadorian (14.0%, a difference of 0.51%), and Korean (14.0%, a difference of 0.54%).
| Demographics | Rating | Rank | Master's Degree |
| Scandinavians | 23.3 /100 | #206 | Fair 14.4% |
| Immigrants | Bosnia and Herzegovina | 22.0 /100 | #207 | Fair 14.3% |
| Immigrants | Barbados | 20.5 /100 | #208 | Fair 14.3% |
| Immigrants | Panama | 20.0 /100 | #209 | Fair 14.3% |
| Sub-Saharan Africans | 19.4 /100 | #210 | Poor 14.2% |
| Somalis | 18.0 /100 | #211 | Poor 14.2% |
| Spanish | 17.8 /100 | #212 | Poor 14.2% |
| Immigrants | Thailand | 17.0 /100 | #213 | Poor 14.2% |
| Finns | 16.9 /100 | #214 | Poor 14.2% |
| Immigrants | Vietnam | 16.1 /100 | #215 | Poor 14.1% |
| Immigrants | Somalia | 15.8 /100 | #216 | Poor 14.1% |
| Immigrants | Trinidad and Tobago | 15.8 /100 | #217 | Poor 14.1% |
| French Canadians | 14.9 /100 | #218 | Poor 14.1% |
| Norwegians | 13.6 /100 | #219 | Poor 14.0% |
| Germans | 13.1 /100 | #220 | Poor 14.0% |
| Koreans | 12.7 /100 | #221 | Poor 14.0% |
| Ecuadorians | 12.6 /100 | #222 | Poor 14.0% |
| Immigrants | South Eastern Asia | 11.9 /100 | #223 | Poor 14.0% |
| Immigrants | Grenada | 11.8 /100 | #224 | Poor 14.0% |
| Portuguese | 11.2 /100 | #225 | Poor 13.9% |
| Immigrants | St. Vincent and the Grenadines | 11.0 /100 | #226 | Poor 13.9% |