Cherokee vs Immigrants from St. Vincent and the Grenadines Master's Degree
COMPARE
Cherokee
Immigrants from St. Vincent and the Grenadines
Master's Degree
Master's Degree Comparison
Cherokee
Immigrants from St. Vincent and the Grenadines
11.4%
MASTER'S DEGREE
0.1/ 100
METRIC RATING
302nd/ 347
METRIC RANK
13.9%
MASTER'S DEGREE
11.0/ 100
METRIC RATING
226th/ 347
METRIC RANK
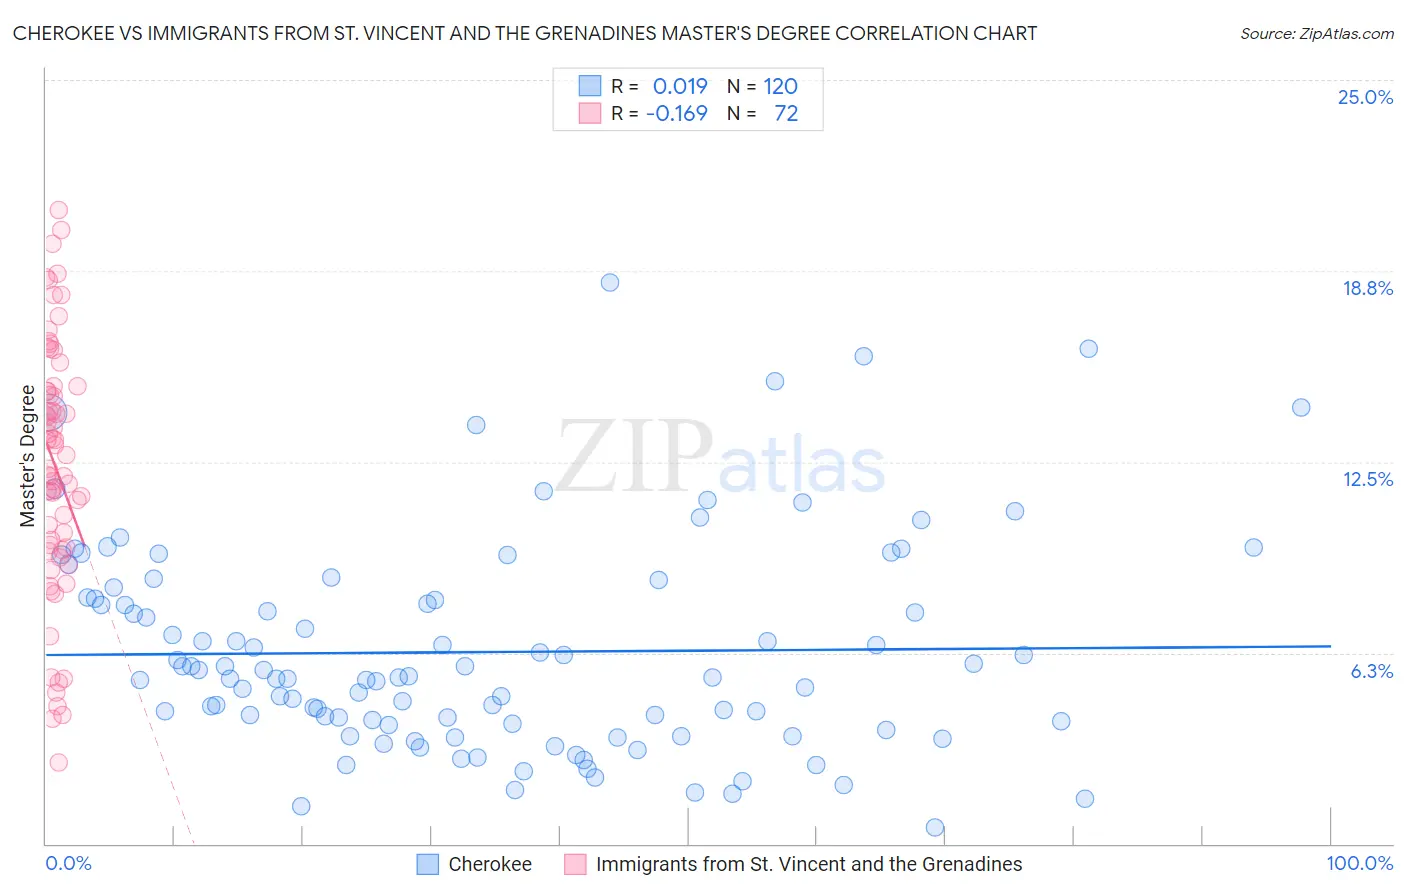
Cherokee vs Immigrants from St. Vincent and the Grenadines Master's Degree Correlation Chart
The statistical analysis conducted on geographies consisting of 493,264,146 people shows no correlation between the proportion of Cherokee and percentage of population with at least master's degree education in the United States with a correlation coefficient (R) of 0.019 and weighted average of 11.4%. Similarly, the statistical analysis conducted on geographies consisting of 56,186,980 people shows a poor negative correlation between the proportion of Immigrants from St. Vincent and the Grenadines and percentage of population with at least master's degree education in the United States with a correlation coefficient (R) of -0.169 and weighted average of 13.9%, a difference of 22.5%.
Master's Degree Correlation Summary
| Measurement | Cherokee | Immigrants from St. Vincent and the Grenadines |
| Minimum | 0.55% | 2.6% |
| Maximum | 18.4% | 20.8% |
| Range | 17.8% | 18.1% |
| Mean | 6.3% | 12.3% |
| Median | 5.4% | 12.5% |
| Interquartile 25% (IQ1) | 3.9% | 9.6% |
| Interquartile 75% (IQ3) | 8.0% | 14.9% |
| Interquartile Range (IQR) | 4.1% | 5.3% |
| Standard Deviation (Sample) | 3.5% | 4.2% |
| Standard Deviation (Population) | 3.4% | 4.1% |
Similar Demographics by Master's Degree
Demographics Similar to Cherokee by Master's Degree
In terms of master's degree, the demographic groups most similar to Cherokee are Immigrants from Laos (11.4%, a difference of 0.020%), Immigrants from Cabo Verde (11.3%, a difference of 0.21%), Tsimshian (11.4%, a difference of 0.31%), Chippewa (11.4%, a difference of 0.47%), and Chickasaw (11.4%, a difference of 0.49%).
| Demographics | Rating | Rank | Master's Degree |
| Marshallese | 0.1 /100 | #295 | Tragic 11.6% |
| Alaskan Athabascans | 0.1 /100 | #296 | Tragic 11.6% |
| Immigrants | Yemen | 0.1 /100 | #297 | Tragic 11.6% |
| Samoans | 0.1 /100 | #298 | Tragic 11.5% |
| Chickasaw | 0.1 /100 | #299 | Tragic 11.4% |
| Chippewa | 0.1 /100 | #300 | Tragic 11.4% |
| Tsimshian | 0.1 /100 | #301 | Tragic 11.4% |
| Cherokee | 0.1 /100 | #302 | Tragic 11.4% |
| Immigrants | Laos | 0.1 /100 | #303 | Tragic 11.4% |
| Immigrants | Cabo Verde | 0.1 /100 | #304 | Tragic 11.3% |
| Immigrants | Latin America | 0.0 /100 | #305 | Tragic 11.3% |
| Mexican American Indians | 0.0 /100 | #306 | Tragic 11.2% |
| Cheyenne | 0.0 /100 | #307 | Tragic 11.2% |
| Puerto Ricans | 0.0 /100 | #308 | Tragic 11.2% |
| Puget Sound Salish | 0.0 /100 | #309 | Tragic 11.1% |
Demographics Similar to Immigrants from St. Vincent and the Grenadines by Master's Degree
In terms of master's degree, the demographic groups most similar to Immigrants from St. Vincent and the Grenadines are Portuguese (13.9%, a difference of 0.050%), Immigrants from Grenada (14.0%, a difference of 0.26%), Immigrants from South Eastern Asia (14.0%, a difference of 0.31%), Immigrants from West Indies (13.9%, a difference of 0.44%), and Ecuadorian (14.0%, a difference of 0.51%).
| Demographics | Rating | Rank | Master's Degree |
| Norwegians | 13.6 /100 | #219 | Poor 14.0% |
| Germans | 13.1 /100 | #220 | Poor 14.0% |
| Koreans | 12.7 /100 | #221 | Poor 14.0% |
| Ecuadorians | 12.6 /100 | #222 | Poor 14.0% |
| Immigrants | South Eastern Asia | 11.9 /100 | #223 | Poor 14.0% |
| Immigrants | Grenada | 11.8 /100 | #224 | Poor 14.0% |
| Portuguese | 11.2 /100 | #225 | Poor 13.9% |
| Immigrants | St. Vincent and the Grenadines | 11.0 /100 | #226 | Poor 13.9% |
| Immigrants | West Indies | 9.8 /100 | #227 | Tragic 13.9% |
| Whites/Caucasians | 9.1 /100 | #228 | Tragic 13.8% |
| British West Indians | 8.8 /100 | #229 | Tragic 13.8% |
| Dutch | 8.7 /100 | #230 | Tragic 13.8% |
| Guyanese | 7.6 /100 | #231 | Tragic 13.7% |
| Immigrants | Philippines | 6.0 /100 | #232 | Tragic 13.6% |
| Immigrants | Ecuador | 5.7 /100 | #233 | Tragic 13.6% |