Immigrants from Bolivia vs Serbian No Schooling Completed
COMPARE
Immigrants from Bolivia
Serbian
No Schooling Completed
No Schooling Completed Comparison
Immigrants from Bolivia
Serbians
2.5%
NO SCHOOLING COMPLETED
0.2/ 100
METRIC RATING
272nd/ 347
METRIC RANK
1.7%
NO SCHOOLING COMPLETED
99.7/ 100
METRIC RATING
65th/ 347
METRIC RANK
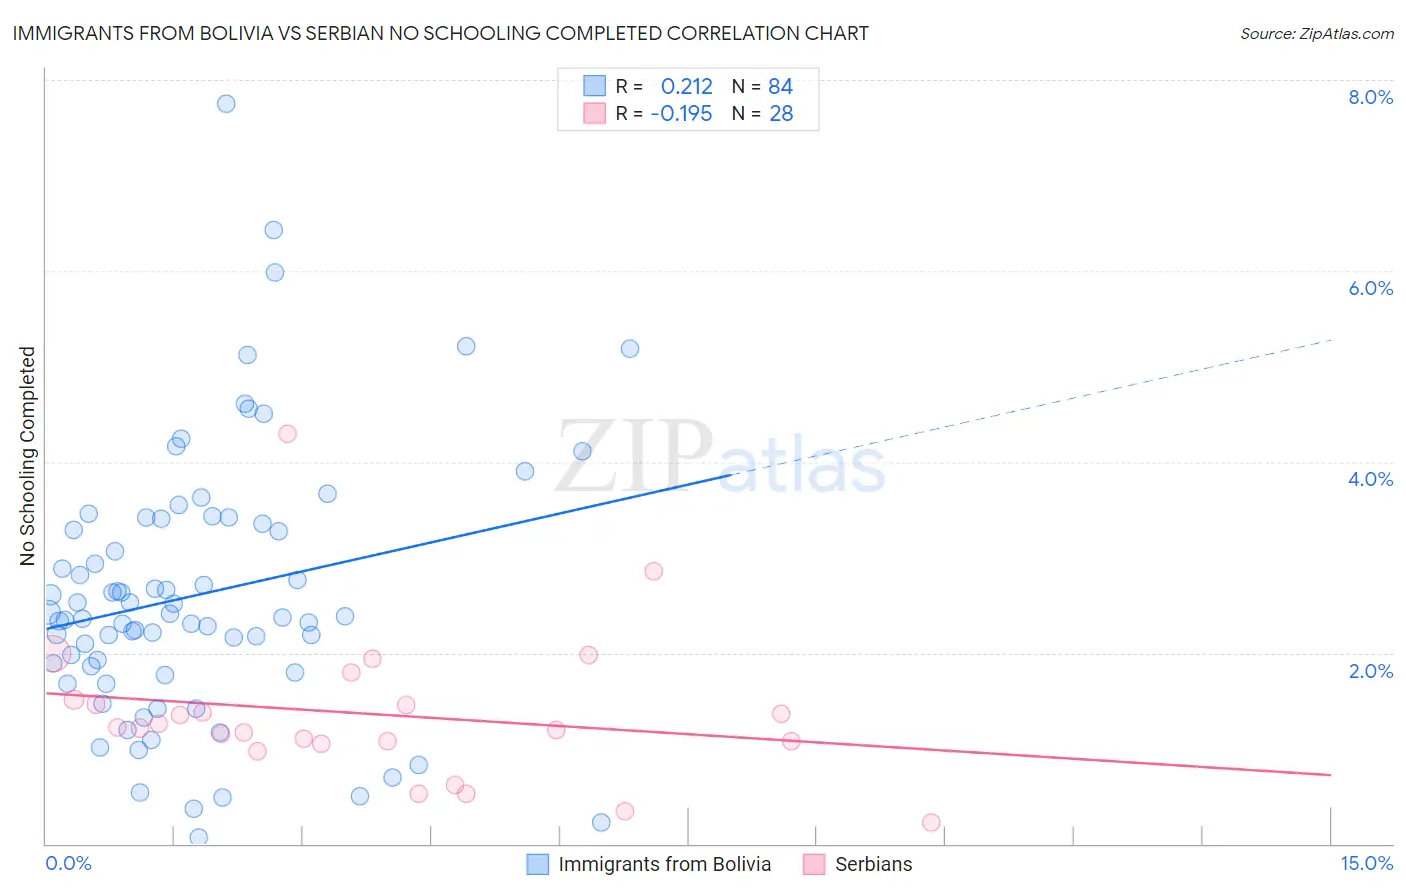
Immigrants from Bolivia vs Serbian No Schooling Completed Correlation Chart
The statistical analysis conducted on geographies consisting of 158,366,441 people shows a weak positive correlation between the proportion of Immigrants from Bolivia and percentage of population with no schooling in the United States with a correlation coefficient (R) of 0.212 and weighted average of 2.5%. Similarly, the statistical analysis conducted on geographies consisting of 265,248,882 people shows a poor negative correlation between the proportion of Serbians and percentage of population with no schooling in the United States with a correlation coefficient (R) of -0.195 and weighted average of 1.7%, a difference of 51.3%.
No Schooling Completed Correlation Summary
| Measurement | Immigrants from Bolivia | Serbian |
| Minimum | 0.063% | 0.23% |
| Maximum | 7.8% | 4.3% |
| Range | 7.7% | 4.1% |
| Mean | 2.6% | 1.4% |
| Median | 2.4% | 1.2% |
| Interquartile 25% (IQ1) | 1.8% | 1.1% |
| Interquartile 75% (IQ3) | 3.4% | 1.5% |
| Interquartile Range (IQR) | 1.5% | 0.43% |
| Standard Deviation (Sample) | 1.4% | 0.80% |
| Standard Deviation (Population) | 1.4% | 0.78% |
Similar Demographics by No Schooling Completed
Demographics Similar to Immigrants from Bolivia by No Schooling Completed
In terms of no schooling completed, the demographic groups most similar to Immigrants from Bolivia are Cuban (2.5%, a difference of 0.53%), Immigrants from Peru (2.5%, a difference of 0.54%), Immigrants from Nigeria (2.5%, a difference of 0.62%), Immigrants from Cameroon (2.5%, a difference of 0.79%), and Ghanaian (2.6%, a difference of 1.2%).
| Demographics | Rating | Rank | No Schooling Completed |
| West Indians | 0.4 /100 | #265 | Tragic 2.5% |
| Fijians | 0.4 /100 | #266 | Tragic 2.5% |
| Yuman | 0.4 /100 | #267 | Tragic 2.5% |
| Taiwanese | 0.3 /100 | #268 | Tragic 2.5% |
| Immigrants | Nigeria | 0.2 /100 | #269 | Tragic 2.5% |
| Immigrants | Peru | 0.2 /100 | #270 | Tragic 2.5% |
| Cubans | 0.2 /100 | #271 | Tragic 2.5% |
| Immigrants | Bolivia | 0.2 /100 | #272 | Tragic 2.5% |
| Immigrants | Cameroon | 0.1 /100 | #273 | Tragic 2.5% |
| Ghanaians | 0.1 /100 | #274 | Tragic 2.6% |
| Immigrants | China | 0.1 /100 | #275 | Tragic 2.6% |
| Immigrants | Western Africa | 0.1 /100 | #276 | Tragic 2.6% |
| Immigrants | Philippines | 0.1 /100 | #277 | Tragic 2.6% |
| Immigrants | Uzbekistan | 0.1 /100 | #278 | Tragic 2.6% |
| Barbadians | 0.1 /100 | #279 | Tragic 2.6% |
Demographics Similar to Serbians by No Schooling Completed
In terms of no schooling completed, the demographic groups most similar to Serbians are New Zealander (1.7%, a difference of 0.040%), Canadian (1.7%, a difference of 0.14%), Russian (1.7%, a difference of 0.20%), Immigrants from Northern Europe (1.7%, a difference of 0.24%), and Immigrants from Austria (1.7%, a difference of 0.33%).
| Demographics | Rating | Rank | No Schooling Completed |
| Kiowa | 99.8 /100 | #58 | Exceptional 1.6% |
| Slavs | 99.8 /100 | #59 | Exceptional 1.7% |
| Americans | 99.8 /100 | #60 | Exceptional 1.7% |
| Tsimshian | 99.8 /100 | #61 | Exceptional 1.7% |
| Immigrants | Northern Europe | 99.8 /100 | #62 | Exceptional 1.7% |
| Russians | 99.8 /100 | #63 | Exceptional 1.7% |
| New Zealanders | 99.7 /100 | #64 | Exceptional 1.7% |
| Serbians | 99.7 /100 | #65 | Exceptional 1.7% |
| Canadians | 99.7 /100 | #66 | Exceptional 1.7% |
| Immigrants | Austria | 99.7 /100 | #67 | Exceptional 1.7% |
| Immigrants | Lithuania | 99.7 /100 | #68 | Exceptional 1.7% |
| Chickasaw | 99.6 /100 | #69 | Exceptional 1.7% |
| Immigrants | Netherlands | 99.6 /100 | #70 | Exceptional 1.7% |
| Immigrants | England | 99.5 /100 | #71 | Exceptional 1.7% |
| Cajuns | 99.5 /100 | #72 | Exceptional 1.7% |