Immigrants from Bolivia vs Immigrants from Bahamas High School Diploma
COMPARE
Immigrants from Bolivia
Immigrants from Bahamas
High School Diploma
High School Diploma Comparison
Immigrants from Bolivia
Immigrants from Bahamas
88.4%
HIGH SCHOOL DIPLOMA
10.3/ 100
METRIC RATING
218th/ 347
METRIC RANK
88.0%
HIGH SCHOOL DIPLOMA
2.9/ 100
METRIC RATING
235th/ 347
METRIC RANK
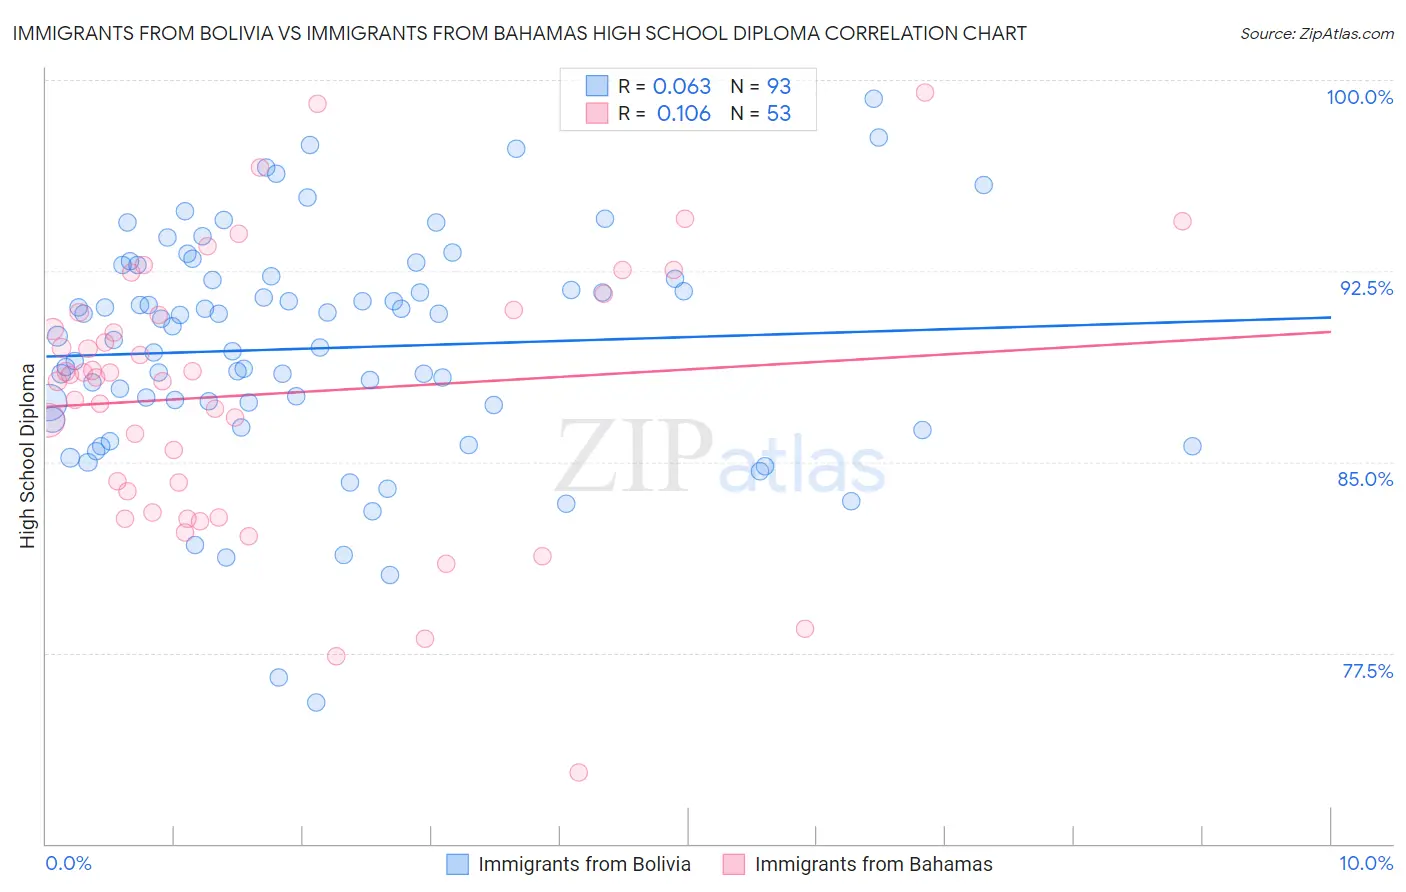
Immigrants from Bolivia vs Immigrants from Bahamas High School Diploma Correlation Chart
The statistical analysis conducted on geographies consisting of 158,727,043 people shows a slight positive correlation between the proportion of Immigrants from Bolivia and percentage of population with at least high school diploma education in the United States with a correlation coefficient (R) of 0.063 and weighted average of 88.4%. Similarly, the statistical analysis conducted on geographies consisting of 104,665,790 people shows a poor positive correlation between the proportion of Immigrants from Bahamas and percentage of population with at least high school diploma education in the United States with a correlation coefficient (R) of 0.106 and weighted average of 88.0%, a difference of 0.51%.
High School Diploma Correlation Summary
| Measurement | Immigrants from Bolivia | Immigrants from Bahamas |
| Minimum | 75.5% | 72.8% |
| Maximum | 99.3% | 99.5% |
| Range | 23.7% | 26.7% |
| Mean | 89.5% | 87.7% |
| Median | 89.9% | 88.4% |
| Interquartile 25% (IQ1) | 86.9% | 83.4% |
| Interquartile 75% (IQ3) | 92.3% | 90.9% |
| Interquartile Range (IQR) | 5.3% | 7.5% |
| Standard Deviation (Sample) | 4.5% | 5.4% |
| Standard Deviation (Population) | 4.4% | 5.3% |
Demographics Similar to Immigrants from Bolivia and Immigrants from Bahamas by High School Diploma
In terms of high school diploma, the demographic groups most similar to Immigrants from Bolivia are Immigrants from Africa (88.4%, a difference of 0.010%), Chickasaw (88.4%, a difference of 0.020%), Costa Rican (88.4%, a difference of 0.030%), Tongan (88.4%, a difference of 0.030%), and Immigrants from Afghanistan (88.3%, a difference of 0.070%). Similarly, the demographic groups most similar to Immigrants from Bahamas are Immigrants from Panama (88.0%, a difference of 0.020%), Immigrants from Thailand (88.0%, a difference of 0.020%), Subsaharan African (87.9%, a difference of 0.020%), Immigrants from Middle Africa (88.0%, a difference of 0.060%), and Colombian (88.1%, a difference of 0.10%).
| Demographics | Rating | Rank | High School Diploma |
| Chickasaw | 10.7 /100 | #216 | Poor 88.4% |
| Immigrants | Africa | 10.6 /100 | #217 | Poor 88.4% |
| Immigrants | Bolivia | 10.3 /100 | #218 | Poor 88.4% |
| Costa Ricans | 9.6 /100 | #219 | Tragic 88.4% |
| Tongans | 9.5 /100 | #220 | Tragic 88.4% |
| Immigrants | Afghanistan | 8.6 /100 | #221 | Tragic 88.3% |
| Colville | 7.8 /100 | #222 | Tragic 88.3% |
| Immigrants | Zaire | 7.6 /100 | #223 | Tragic 88.3% |
| Shoshone | 7.0 /100 | #224 | Tragic 88.3% |
| Creek | 6.9 /100 | #225 | Tragic 88.3% |
| Uruguayans | 5.6 /100 | #226 | Tragic 88.2% |
| Immigrants | Liberia | 5.5 /100 | #227 | Tragic 88.2% |
| Kiowa | 5.3 /100 | #228 | Tragic 88.2% |
| Nigerians | 5.2 /100 | #229 | Tragic 88.2% |
| Blackfeet | 4.2 /100 | #230 | Tragic 88.1% |
| Colombians | 3.8 /100 | #231 | Tragic 88.1% |
| Immigrants | Middle Africa | 3.4 /100 | #232 | Tragic 88.0% |
| Immigrants | Panama | 3.1 /100 | #233 | Tragic 88.0% |
| Immigrants | Thailand | 3.1 /100 | #234 | Tragic 88.0% |
| Immigrants | Bahamas | 2.9 /100 | #235 | Tragic 88.0% |
| Sub-Saharan Africans | 2.8 /100 | #236 | Tragic 87.9% |