Immigrants from Belize vs Pennsylvania German 3rd Grade

COMPARE

Immigrants from Belize
Race
Ancestry
AfghanAfricanAlaska NativeAlaskan AthabascanAlbanianAleutAlsatianAmericanApacheArabArapahoArgentineanArmenianAssyrian/Chaldean/SyriacAustralianAustrianBahamianBangladeshiBarbadianBasqueBelgianBelizeanBermudanBhutaneseBlackfeetBolivianBrazilianBritishBritish West IndianBulgarianBurmeseCajunCambodianCanadianCape VerdeanCarpatho RusynCelticCentral AmericanCentral American IndianCherokeeCheyenneChickasawChileanChineseChippewaChoctawColombianColvilleComancheCosta RicanCreeCreekCroatianCrowCubanCypriotCzechCzechoslovakianDanishDelawareDominicanDutchDutch West IndianEastern EuropeanEcuadorianEgyptianEnglishEstonianEthiopianEuropeanFijianFilipinoFinnishFrenchFrench American IndianFrench CanadianGermanGerman RussianGhanaianGreekGuamanian/ChamorroGuatemalanGuyaneseHaitianHmongHonduranHopiHoumaHungarianIcelanderIndian (Asian)IndonesianInupiatIranianIraqiIrishIroquoisIsraeliItalianJamaicanJapaneseJordanianKenyanKiowaKoreanLaotianLatvianLebaneseLiberianLithuanianLumbeeLuxembourgerMacedonianMalaysianMalteseMarshalleseMenomineeMexicanMexican American IndianMongolianMoroccanNative HawaiianNavajoNepaleseNew ZealanderNicaraguanNigerianNorthern EuropeanNorwegianOkinawanOsageOttawaPaiutePakistaniPalestinianPanamanianParaguayanPeruvianPimaPolishPortuguesePotawatomiPuebloPuerto RicanPuget Sound SalishRomanianRussianSalvadoranSamoanScandinavianScotch-IrishScottishSeminoleSenegaleseSerbianShoshoneSierra LeoneanSiouxSlavicSlovakSloveneSomaliSouth AfricanSouth AmericanSouth American IndianSoviet UnionSpaniardSpanishSpanish AmericanSpanish American IndianSri LankanSubsaharan AfricanSudaneseSwedishSwissSyrianTaiwaneseThaiTlingit-HaidaTohono O'OdhamTonganTrinidadian and TobagonianTsimshianTurkishU.S. Virgin IslanderUgandanUkrainianUruguayanUteVenezuelanVietnameseWelshWest IndianYakamaYaquiYugoslavianYumanYup'ikZimbabwean
Immigration
NonimmigrantsImmigrantsAfghanistanAfricaAlbaniaArgentinaArmeniaAsiaAustraliaAustriaBahamasBangladeshBarbadosBelarusBelgiumBelizeBoliviaBosnia and HerzegovinaBrazilBulgariaBurma/MyanmarCabo VerdeCambodiaCameroonCanadaCaribbeanCentral AmericaChileChinaColombiaCongoCosta RicaCroatiaCubaCzechoslovakiaDenmarkDominicaDominican RepublicEastern AfricaEastern AsiaEastern EuropeEcuadorEgyptEl SalvadorEnglandEritreaEthiopiaEuropeFijiFranceGermanyGhanaGreeceGrenadaGuatemalaGuyanaHaitiHondurasHong KongHungaryIndiaIndonesiaIranIraqIrelandIsraelItalyJamaicaJapanJordanKazakhstanKenyaKoreaKuwaitLaosLatin AmericaLatviaLebanonLiberiaLithuaniaMalaysiaMexicoMicronesiaMiddle AfricaMoldovaMoroccoNepalNetherlandsNicaraguaNigeriaNorth AmericaNorth MacedoniaNorthern AfricaNorthern EuropeNorwayOceaniaPakistanPanamaPeruPhilippinesPolandPortugalRomaniaRussiaSaudi ArabiaScotlandSenegalSerbiaSierra LeoneSingaporeSomaliaSouth AfricaSouth AmericaSouth Central AsiaSouth Eastern AsiaSouthern EuropeSpainSri LankaSt. Vincent and the GrenadinesSudanSwedenSwitzerlandSyriaTaiwanThailandTrinidad and TobagoTurkeyUgandaUkraineUruguayUzbekistanVenezuelaVietnamWest IndiesWestern AfricaWestern AsiaWestern EuropeYemenZaireZimbabweAzores
Pennsylvania German
Race
Ancestry
AfghanAfricanAlaska NativeAlaskan AthabascanAlbanianAleutAlsatianAmericanApacheArabArapahoArgentineanArmenianAssyrian/Chaldean/SyriacAustralianAustrianBahamianBangladeshiBarbadianBasqueBelgianBelizeanBermudanBhutaneseBlackfeetBolivianBrazilianBritishBritish West IndianBulgarianBurmeseCajunCambodianCanadianCape VerdeanCarpatho RusynCelticCentral AmericanCentral American IndianCherokeeCheyenneChickasawChileanChineseChippewaChoctawColombianColvilleComancheCosta RicanCreeCreekCroatianCrowCubanCypriotCzechCzechoslovakianDanishDelawareDominicanDutchDutch West IndianEastern EuropeanEcuadorianEgyptianEnglishEstonianEthiopianEuropeanFijianFilipinoFinnishFrenchFrench American IndianFrench CanadianGermanGerman RussianGhanaianGreekGuamanian/ChamorroGuatemalanGuyaneseHaitianHmongHonduranHopiHoumaHungarianIcelanderIndian (Asian)IndonesianInupiatIranianIraqiIrishIroquoisIsraeliItalianJamaicanJapaneseJordanianKenyanKiowaKoreanLaotianLatvianLebaneseLiberianLithuanianLumbeeLuxembourgerMacedonianMalaysianMalteseMarshalleseMenomineeMexicanMexican American IndianMongolianMoroccanNative HawaiianNavajoNepaleseNew ZealanderNicaraguanNigerianNorthern EuropeanNorwegianOkinawanOsageOttawaPaiutePakistaniPalestinianPanamanianParaguayanPennsylvania GermanPeruvianPimaPolishPortuguesePotawatomiPuebloPuerto RicanPuget Sound SalishRomanianRussianSalvadoranSamoanScandinavianScotch-IrishScottishSeminoleSenegaleseSerbianShoshoneSierra LeoneanSiouxSlavicSlovakSloveneSomaliSouth AfricanSouth AmericanSouth American IndianSoviet UnionSpaniardSpanishSpanish AmericanSpanish American IndianSri LankanSubsaharan AfricanSudaneseSwedishSwissSyrianTaiwaneseThaiTlingit-HaidaTohono O'OdhamTonganTrinidadian and TobagonianTsimshianTurkishU.S. Virgin IslanderUgandanUkrainianUruguayanUteVenezuelanVietnameseWelshWest IndianYakamaYaquiYugoslavianYumanYup'ikZimbabwean
Immigration
NonimmigrantsImmigrantsAfghanistanAfricaAlbaniaArgentinaArmeniaAsiaAustraliaAustriaBahamasBangladeshBarbadosBelarusBelgiumBoliviaBosnia and HerzegovinaBrazilBulgariaBurma/MyanmarCabo VerdeCambodiaCameroonCanadaCaribbeanCentral AmericaChileChinaColombiaCongoCosta RicaCroatiaCubaCzechoslovakiaDenmarkDominicaDominican RepublicEastern AfricaEastern AsiaEastern EuropeEcuadorEgyptEl SalvadorEnglandEritreaEthiopiaEuropeFijiFranceGermanyGhanaGreeceGrenadaGuatemalaGuyanaHaitiHondurasHong KongHungaryIndiaIndonesiaIranIraqIrelandIsraelItalyJamaicaJapanJordanKazakhstanKenyaKoreaKuwaitLaosLatin AmericaLatviaLebanonLiberiaLithuaniaMalaysiaMexicoMicronesiaMiddle AfricaMoldovaMoroccoNepalNetherlandsNicaraguaNigeriaNorth AmericaNorth MacedoniaNorthern AfricaNorthern EuropeNorwayOceaniaPakistanPanamaPeruPhilippinesPolandPortugalRomaniaRussiaSaudi ArabiaScotlandSenegalSerbiaSierra LeoneSingaporeSomaliaSouth AfricaSouth AmericaSouth Central AsiaSouth Eastern AsiaSouthern EuropeSpainSri LankaSt. Vincent and the GrenadinesSudanSwedenSwitzerlandSyriaTaiwanThailandTrinidad and TobagoTurkeyUgandaUkraineUruguayUzbekistanVenezuelaVietnamWest IndiesWestern AfricaWestern AsiaWestern EuropeYemenZaireZimbabweAzores
3rd Grade
Income
Poverty
Unemployment
Labor Participation
Family Structure
Vehicle Availability
Education Level
Disability

3rd Grade Comparison

Immigrants from Belize

Pennsylvania Germans

Tragic
Exceptional
96.5%
3RD GRADE
0.0/ 100
METRIC RATING
322nd/ 347
METRIC RANK
98.5%
3RD GRADE
100.0/ 100
METRIC RATING
20th/ 347
METRIC RANK

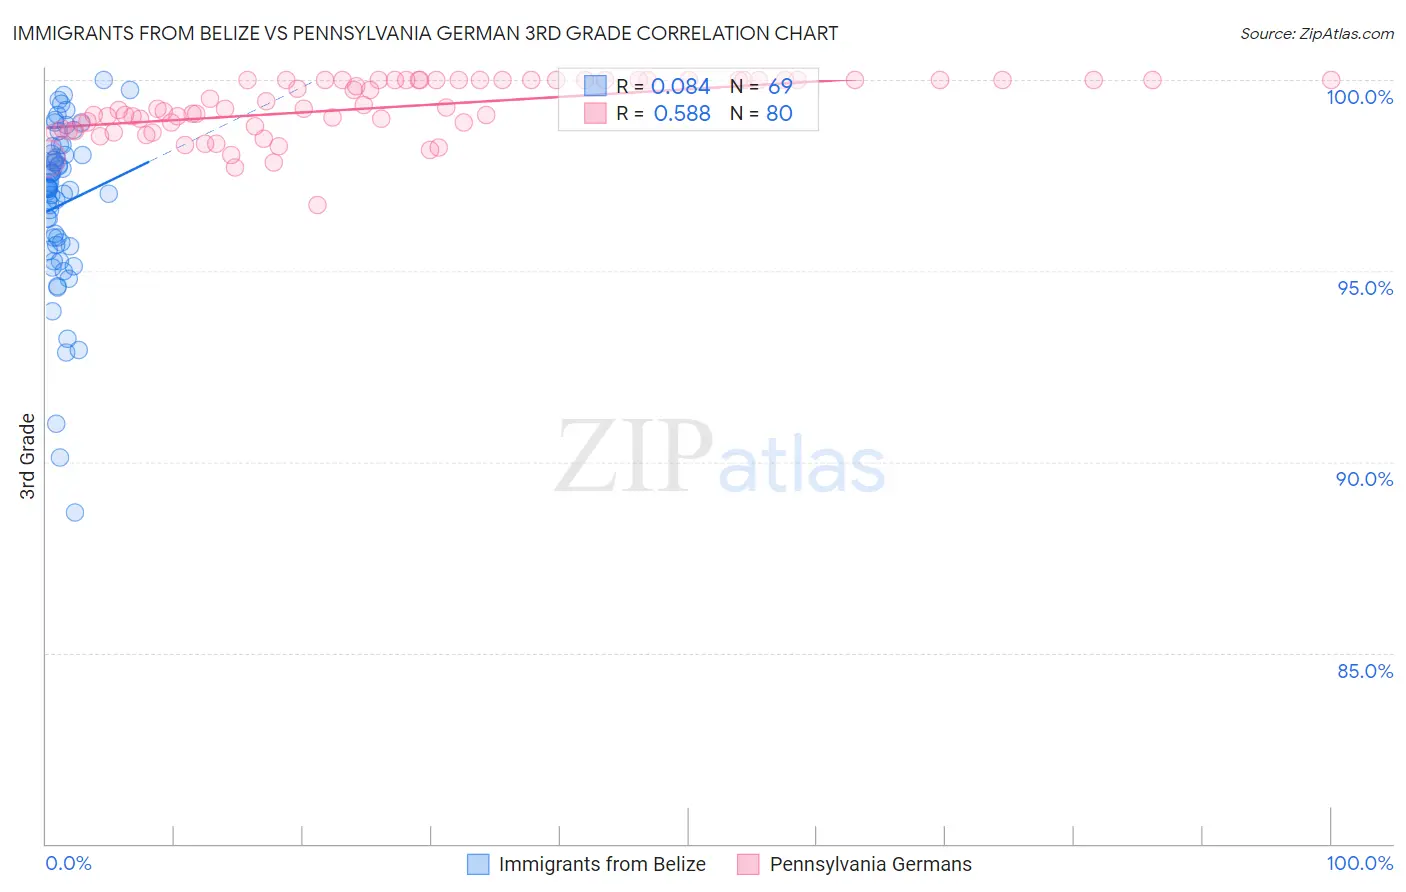
Immigrants from Belize vs Pennsylvania German 3rd Grade Correlation Chart

The statistical analysis conducted on geographies consisting of 130,328,311 people shows a slight positive correlation between the proportion of Immigrants from Belize and percentage of population with at least 3rd grade education in the United States with a correlation coefficient (R) of 0.084 and weighted average of 96.5%. Similarly, the statistical analysis conducted on geographies consisting of 234,102,531 people shows a substantial positive correlation between the proportion of Pennsylvania Germans and percentage of population with at least 3rd grade education in the United States with a correlation coefficient (R) of 0.588 and weighted average of 98.5%, a difference of 2.1%.
Immigrants from Belize vs Pennsylvania German 3rd Grade

3rd Grade Correlation Summary

MeasurementImmigrants from BelizePennsylvania German
Minimum88.7%96.7%
Maximum100.0%100.0%
Range11.3%3.3%
Mean96.7%99.3%
Median97.2%99.2%
Interquartile 25% (IQ1)95.7%98.8%
Interquartile 75% (IQ3)98.1%100.0%
Interquartile Range (IQR)2.4%1.2%
Standard Deviation (Sample)2.2%0.74%
Standard Deviation (Population)2.2%0.74%

Similar Demographics by 3rd Grade

Demographics Similar to Immigrants from Belize by 3rd Grade

In terms of 3rd grade, the demographic groups most similar to Immigrants from Belize are Immigrants from Nicaragua (96.5%, a difference of 0.0%), Indonesian (96.5%, a difference of 0.0%), Vietnamese (96.5%, a difference of 0.020%), Honduran (96.5%, a difference of 0.020%), and Hispanic or Latino (96.5%, a difference of 0.030%).
DemographicsRating | Rank3rd Grade
Immigrants | Azores
0.0
/100
|
#315
Tragic
96.6%
Immigrants | Burma/Myanmar
0.0
/100
|
#316
Tragic
96.6%
Immigrants | Bangladesh
0.0
/100
|
#317
Tragic
96.6%
Hispanics or Latinos
0.0
/100
|
#318
Tragic
96.5%
Vietnamese
0.0
/100
|
#319
Tragic
96.5%
Immigrants | Nicaragua
0.0
/100
|
#320
Tragic
96.5%
Indonesians
0.0
/100
|
#321
Tragic
96.5%
Immigrants | Belize
0.0
/100
|
#322
Tragic
96.5%
Hondurans
0.0
/100
|
#323
Tragic
96.5%
Dominicans
0.0
/100
|
#324
Tragic
96.4%
Mexican American Indians
0.0
/100
|
#325
Tragic
96.4%
Immigrants | Vietnam
0.0
/100
|
#326
Tragic
96.4%
Japanese
0.0
/100
|
#327
Tragic
96.4%
Bangladeshis
0.0
/100
|
#328
Tragic
96.3%
Immigrants | Honduras
0.0
/100
|
#329
Tragic
96.3%

Demographics Similar to Pennsylvania Germans by 3rd Grade

In terms of 3rd grade, the demographic groups most similar to Pennsylvania Germans are Polish (98.5%, a difference of 0.0%), Lithuanian (98.5%, a difference of 0.0%), Irish (98.5%, a difference of 0.010%), Finnish (98.5%, a difference of 0.010%), and Sioux (98.5%, a difference of 0.010%).
DemographicsRating | Rank3rd Grade
Tlingit-Haida
100.0
/100
|
#13
Exceptional
98.5%
Carpatho Rusyns
100.0
/100
|
#14
Exceptional
98.5%
Swedes
100.0
/100
|
#15
Exceptional
98.5%
Scottish
100.0
/100
|
#16
Exceptional
98.5%
Dutch
100.0
/100
|
#17
Exceptional
98.5%
Irish
100.0
/100
|
#18
Exceptional
98.5%
Poles
100.0
/100
|
#19
Exceptional
98.5%
Pennsylvania Germans
100.0
/100
|
#20
Exceptional
98.5%
Lithuanians
100.0
/100
|
#21
Exceptional
98.5%
Finns
100.0
/100
|
#22
Exceptional
98.5%
Sioux
100.0
/100
|
#23
Exceptional
98.5%
Danes
100.0
/100
|
#24
Exceptional
98.5%
Scotch-Irish
100.0
/100
|
#25
Exceptional
98.5%
Aleuts
100.0
/100
|
#26
Exceptional
98.5%
Croatians
100.0
/100
|
#27
Exceptional
98.5%