Immigrants from Belize vs Nepalese 3rd Grade
COMPARE
Immigrants from Belize
Nepalese
3rd Grade
3rd Grade Comparison
Immigrants from Belize
Nepalese
96.5%
3RD GRADE
0.0/ 100
METRIC RATING
322nd/ 347
METRIC RANK
95.9%
3RD GRADE
0.0/ 100
METRIC RATING
340th/ 347
METRIC RANK
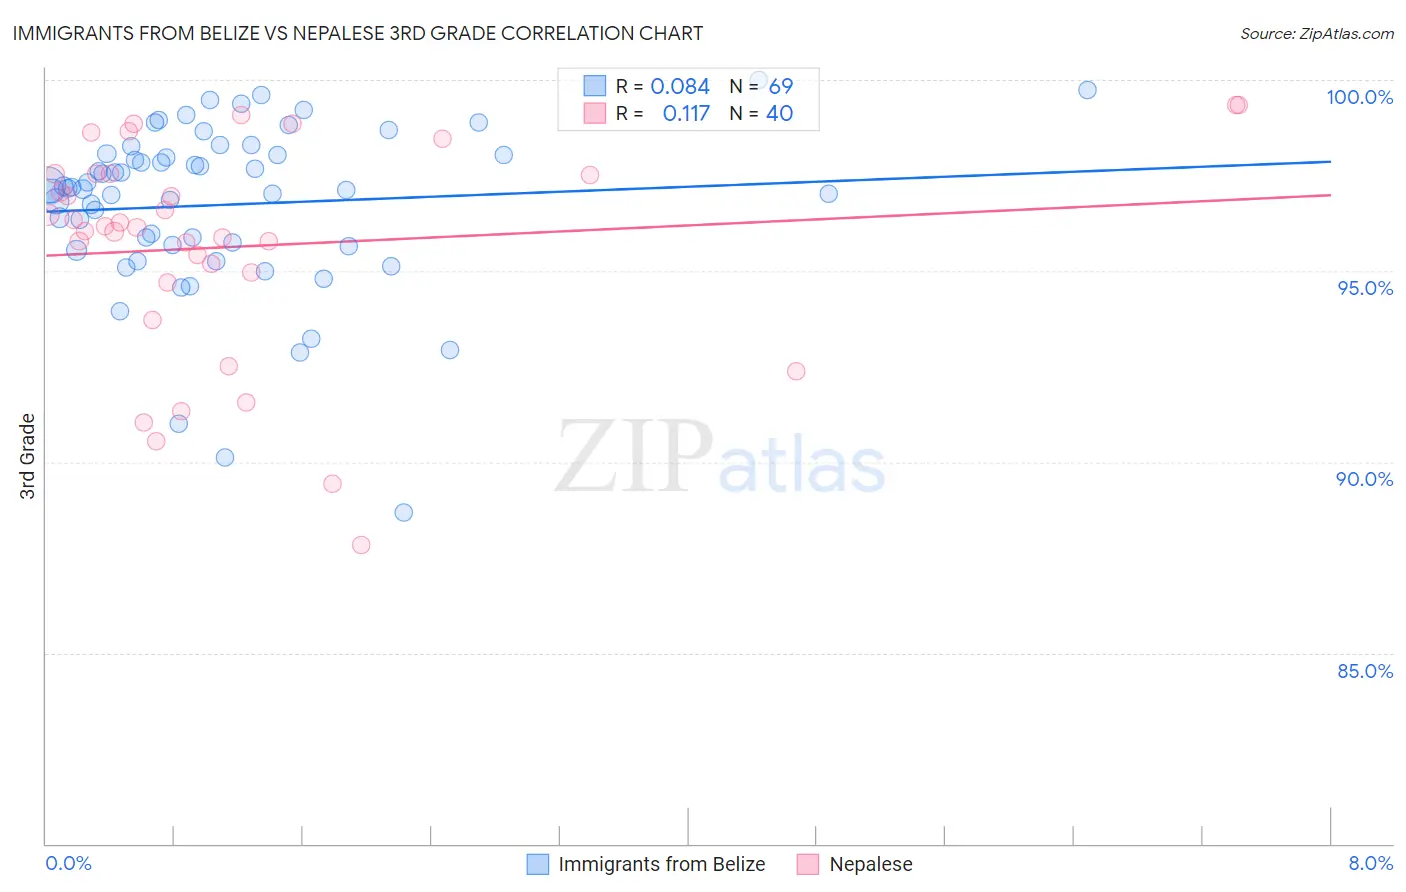
Immigrants from Belize vs Nepalese 3rd Grade Correlation Chart
The statistical analysis conducted on geographies consisting of 130,328,311 people shows a slight positive correlation between the proportion of Immigrants from Belize and percentage of population with at least 3rd grade education in the United States with a correlation coefficient (R) of 0.084 and weighted average of 96.5%. Similarly, the statistical analysis conducted on geographies consisting of 24,521,755 people shows a poor positive correlation between the proportion of Nepalese and percentage of population with at least 3rd grade education in the United States with a correlation coefficient (R) of 0.117 and weighted average of 95.9%, a difference of 0.66%.
3rd Grade Correlation Summary
| Measurement | Immigrants from Belize | Nepalese |
| Minimum | 88.7% | 87.8% |
| Maximum | 100.0% | 99.3% |
| Range | 11.3% | 11.5% |
| Mean | 96.7% | 95.7% |
| Median | 97.2% | 96.2% |
| Interquartile 25% (IQ1) | 95.7% | 94.8% |
| Interquartile 75% (IQ3) | 98.1% | 97.5% |
| Interquartile Range (IQR) | 2.4% | 2.7% |
| Standard Deviation (Sample) | 2.2% | 2.9% |
| Standard Deviation (Population) | 2.2% | 2.8% |
Demographics Similar to Immigrants from Belize and Nepalese by 3rd Grade
In terms of 3rd grade, the demographic groups most similar to Immigrants from Belize are Indonesian (96.5%, a difference of 0.0%), Honduran (96.5%, a difference of 0.020%), Dominican (96.4%, a difference of 0.10%), Mexican American Indian (96.4%, a difference of 0.11%), and Immigrants from Vietnam (96.4%, a difference of 0.15%). Similarly, the demographic groups most similar to Nepalese are Immigrants from Central America (95.8%, a difference of 0.060%), Yakama (95.9%, a difference of 0.080%), Guatemalan (96.0%, a difference of 0.11%), Central American (96.1%, a difference of 0.23%), and Immigrants from Cabo Verde (96.2%, a difference of 0.31%).
| Demographics | Rating | Rank | 3rd Grade |
| Indonesians | 0.0 /100 | #321 | Tragic 96.5% |
| Immigrants | Belize | 0.0 /100 | #322 | Tragic 96.5% |
| Hondurans | 0.0 /100 | #323 | Tragic 96.5% |
| Dominicans | 0.0 /100 | #324 | Tragic 96.4% |
| Mexican American Indians | 0.0 /100 | #325 | Tragic 96.4% |
| Immigrants | Vietnam | 0.0 /100 | #326 | Tragic 96.4% |
| Japanese | 0.0 /100 | #327 | Tragic 96.4% |
| Bangladeshis | 0.0 /100 | #328 | Tragic 96.3% |
| Immigrants | Honduras | 0.0 /100 | #329 | Tragic 96.3% |
| Immigrants | Armenia | 0.0 /100 | #330 | Tragic 96.3% |
| Immigrants | Latin America | 0.0 /100 | #331 | Tragic 96.2% |
| Mexicans | 0.0 /100 | #332 | Tragic 96.2% |
| Immigrants | Fiji | 0.0 /100 | #333 | Tragic 96.2% |
| Immigrants | Cambodia | 0.0 /100 | #334 | Tragic 96.2% |
| Immigrants | Dominican Republic | 0.0 /100 | #335 | Tragic 96.2% |
| Immigrants | Cabo Verde | 0.0 /100 | #336 | Tragic 96.2% |
| Central Americans | 0.0 /100 | #337 | Tragic 96.1% |
| Guatemalans | 0.0 /100 | #338 | Tragic 96.0% |
| Yakama | 0.0 /100 | #339 | Tragic 95.9% |
| Nepalese | 0.0 /100 | #340 | Tragic 95.9% |
| Immigrants | Central America | 0.0 /100 | #341 | Tragic 95.8% |