Immigrants from Belarus vs Slovak Nursery School
COMPARE
Immigrants from Belarus
Slovak
Nursery School
Nursery School Comparison
Immigrants from Belarus
Slovaks
98.0%
NURSERY SCHOOL
41.0/ 100
METRIC RATING
185th/ 347
METRIC RANK
98.7%
NURSERY SCHOOL
100.0/ 100
METRIC RATING
9th/ 347
METRIC RANK
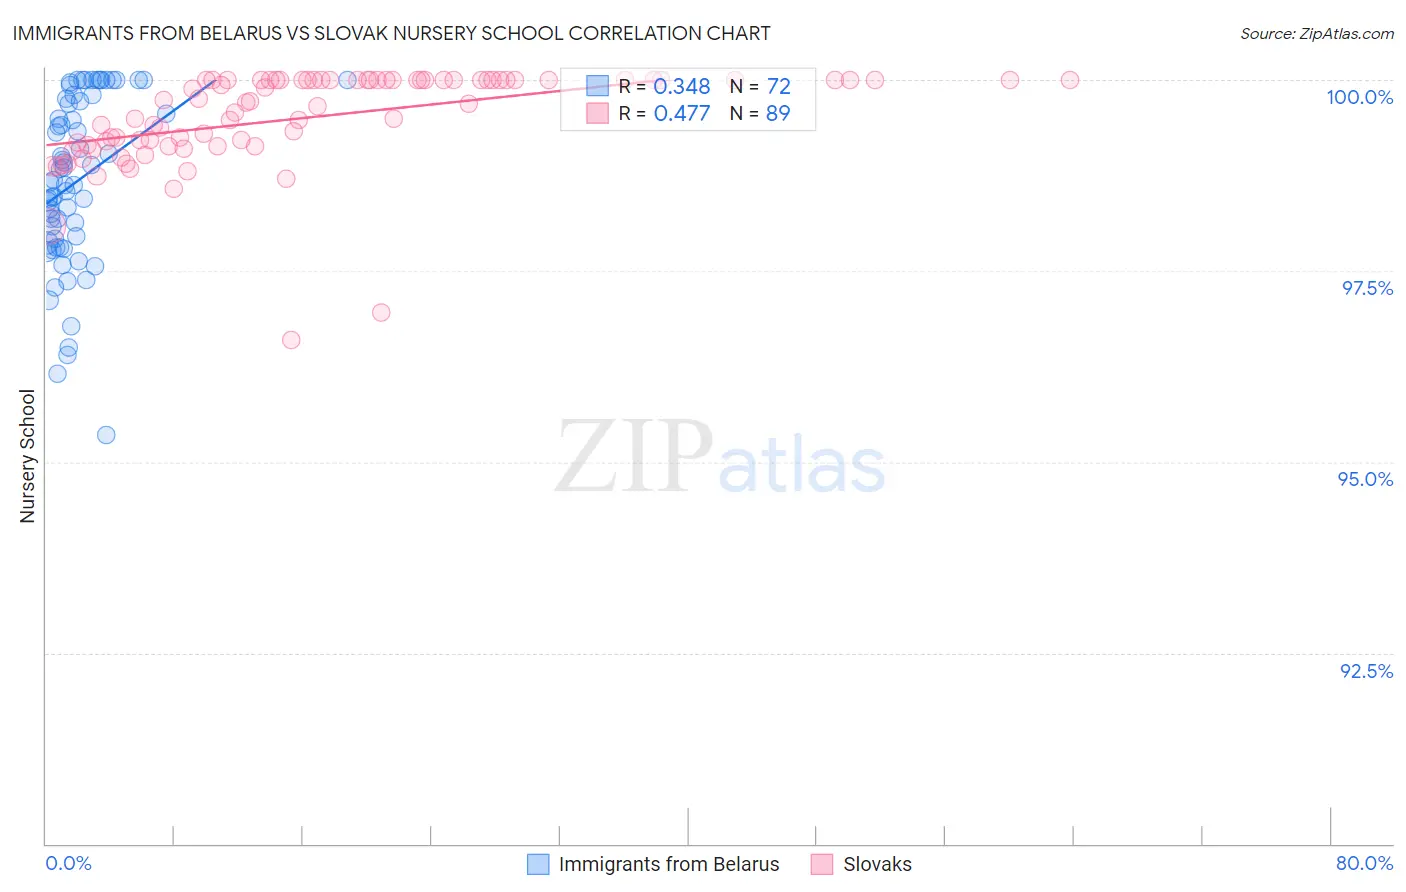
Immigrants from Belarus vs Slovak Nursery School Correlation Chart
The statistical analysis conducted on geographies consisting of 149,993,317 people shows a mild positive correlation between the proportion of Immigrants from Belarus and percentage of population with at least nursery school education in the United States with a correlation coefficient (R) of 0.348 and weighted average of 98.0%. Similarly, the statistical analysis conducted on geographies consisting of 397,891,514 people shows a moderate positive correlation between the proportion of Slovaks and percentage of population with at least nursery school education in the United States with a correlation coefficient (R) of 0.477 and weighted average of 98.7%, a difference of 0.79%.
Nursery School Correlation Summary
| Measurement | Immigrants from Belarus | Slovak |
| Minimum | 95.4% | 96.6% |
| Maximum | 100.0% | 100.0% |
| Range | 4.6% | 3.4% |
| Mean | 98.7% | 99.5% |
| Median | 98.7% | 99.7% |
| Interquartile 25% (IQ1) | 97.9% | 99.1% |
| Interquartile 75% (IQ3) | 99.7% | 100.0% |
| Interquartile Range (IQR) | 1.8% | 0.86% |
| Standard Deviation (Sample) | 1.1% | 0.63% |
| Standard Deviation (Population) | 1.1% | 0.63% |
Similar Demographics by Nursery School
Demographics Similar to Immigrants from Belarus by Nursery School
In terms of nursery school, the demographic groups most similar to Immigrants from Belarus are Paiute (98.0%, a difference of 0.0%), Portuguese (98.0%, a difference of 0.0%), Immigrants from Poland (98.0%, a difference of 0.0%), Immigrants from Argentina (98.0%, a difference of 0.0%), and Immigrants from Bosnia and Herzegovina (98.0%, a difference of 0.010%).
| Demographics | Rating | Rank | Nursery School |
| Natives/Alaskans | 48.6 /100 | #178 | Average 98.0% |
| Argentineans | 46.8 /100 | #179 | Average 98.0% |
| Immigrants | Bosnia and Herzegovina | 45.6 /100 | #180 | Average 98.0% |
| Egyptians | 42.8 /100 | #181 | Average 98.0% |
| Paiute | 42.0 /100 | #182 | Average 98.0% |
| Portuguese | 41.8 /100 | #183 | Average 98.0% |
| Immigrants | Poland | 41.3 /100 | #184 | Average 98.0% |
| Immigrants | Belarus | 41.0 /100 | #185 | Average 98.0% |
| Immigrants | Argentina | 40.8 /100 | #186 | Average 98.0% |
| Immigrants | Kazakhstan | 37.1 /100 | #187 | Fair 97.9% |
| Arabs | 34.7 /100 | #188 | Fair 97.9% |
| Pakistanis | 34.6 /100 | #189 | Fair 97.9% |
| Panamanians | 34.3 /100 | #190 | Fair 97.9% |
| Immigrants | Taiwan | 30.6 /100 | #191 | Fair 97.9% |
| Blacks/African Americans | 29.4 /100 | #192 | Fair 97.9% |
Demographics Similar to Slovaks by Nursery School
In terms of nursery school, the demographic groups most similar to Slovaks are German (98.7%, a difference of 0.0%), Norwegian (98.7%, a difference of 0.010%), Tlingit-Haida (98.7%, a difference of 0.010%), Slovene (98.7%, a difference of 0.020%), and Alaska Native (98.8%, a difference of 0.030%).
| Demographics | Rating | Rank | Nursery School |
| Yup'ik | 100.0 /100 | #2 | Exceptional 99.2% |
| Welsh | 100.0 /100 | #3 | Exceptional 98.9% |
| Inupiat | 100.0 /100 | #4 | Exceptional 98.9% |
| Tsimshian | 100.0 /100 | #5 | Exceptional 98.9% |
| Alaskan Athabascans | 100.0 /100 | #6 | Exceptional 98.8% |
| Alaska Natives | 100.0 /100 | #7 | Exceptional 98.8% |
| Norwegians | 100.0 /100 | #8 | Exceptional 98.7% |
| Slovaks | 100.0 /100 | #9 | Exceptional 98.7% |
| Germans | 100.0 /100 | #10 | Exceptional 98.7% |
| Tlingit-Haida | 100.0 /100 | #11 | Exceptional 98.7% |
| Slovenes | 100.0 /100 | #12 | Exceptional 98.7% |
| English | 100.0 /100 | #13 | Exceptional 98.7% |
| Carpatho Rusyns | 100.0 /100 | #14 | Exceptional 98.7% |
| Swedes | 100.0 /100 | #15 | Exceptional 98.7% |
| Scottish | 100.0 /100 | #16 | Exceptional 98.7% |