Immigrants from Belarus vs Costa Rican 5th Grade
COMPARE
Immigrants from Belarus
Costa Rican
5th Grade
5th Grade Comparison
Immigrants from Belarus
Costa Ricans
97.3%
5TH GRADE
54.6/ 100
METRIC RATING
167th/ 347
METRIC RANK
97.1%
5TH GRADE
7.7/ 100
METRIC RATING
214th/ 347
METRIC RANK
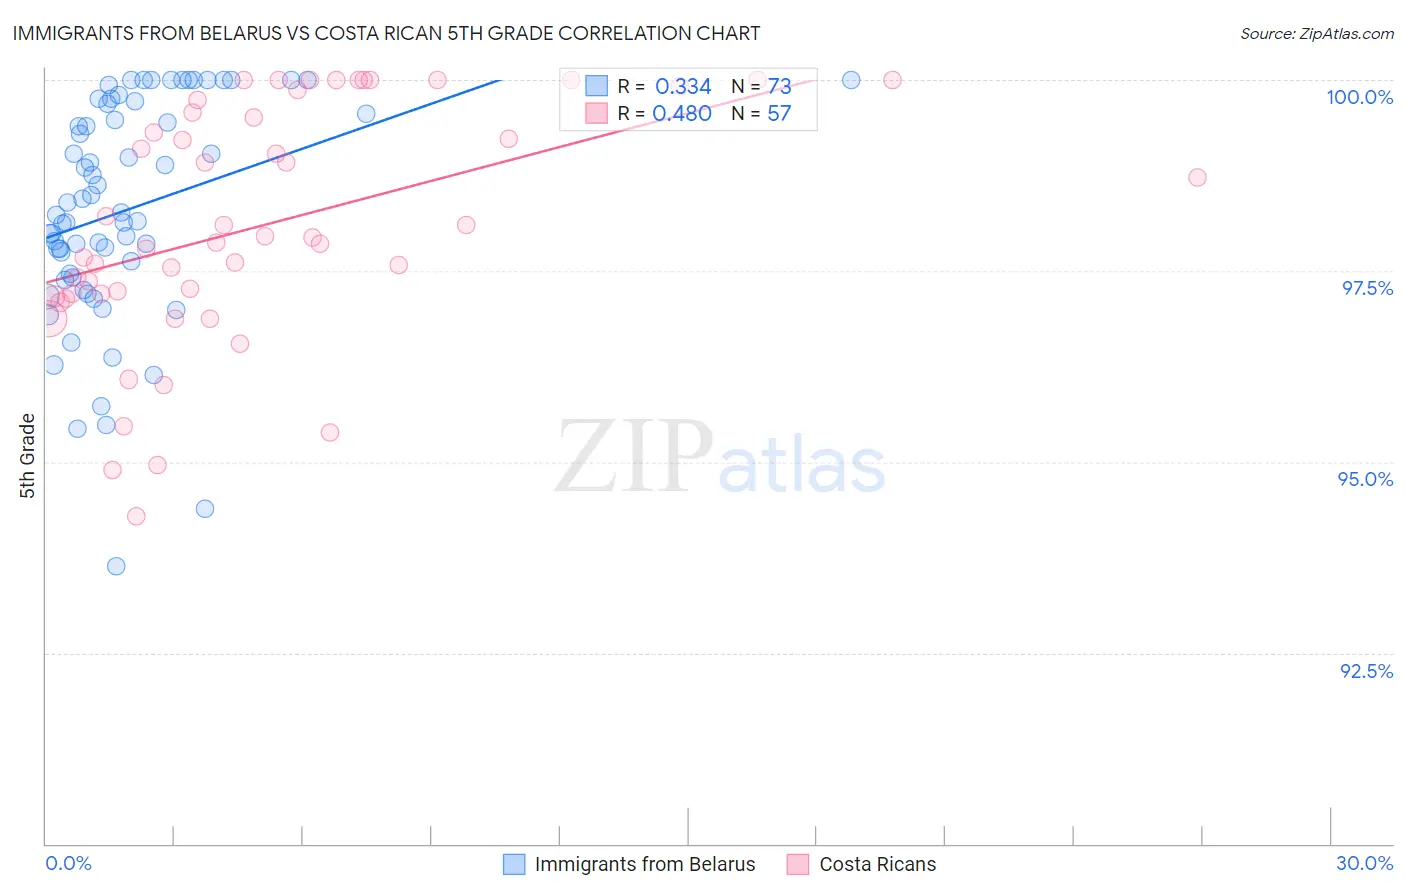
Immigrants from Belarus vs Costa Rican 5th Grade Correlation Chart
The statistical analysis conducted on geographies consisting of 150,073,430 people shows a mild positive correlation between the proportion of Immigrants from Belarus and percentage of population with at least 5th grade education in the United States with a correlation coefficient (R) of 0.334 and weighted average of 97.3%. Similarly, the statistical analysis conducted on geographies consisting of 253,599,979 people shows a moderate positive correlation between the proportion of Costa Ricans and percentage of population with at least 5th grade education in the United States with a correlation coefficient (R) of 0.480 and weighted average of 97.1%, a difference of 0.28%.
5th Grade Correlation Summary
| Measurement | Immigrants from Belarus | Costa Rican |
| Minimum | 93.6% | 94.3% |
| Maximum | 100.0% | 100.0% |
| Range | 6.4% | 5.7% |
| Mean | 98.3% | 98.1% |
| Median | 98.3% | 97.9% |
| Interquartile 25% (IQ1) | 97.4% | 97.2% |
| Interquartile 75% (IQ3) | 99.7% | 99.7% |
| Interquartile Range (IQR) | 2.3% | 2.5% |
| Standard Deviation (Sample) | 1.5% | 1.5% |
| Standard Deviation (Population) | 1.4% | 1.5% |
Similar Demographics by 5th Grade
Demographics Similar to Immigrants from Belarus by 5th Grade
In terms of 5th grade, the demographic groups most similar to Immigrants from Belarus are Chilean (97.3%, a difference of 0.0%), Immigrants from Korea (97.3%, a difference of 0.0%), Venezuelan (97.3%, a difference of 0.0%), Immigrants from Sri Lanka (97.3%, a difference of 0.0%), and Arab (97.3%, a difference of 0.0%).
| Demographics | Rating | Rank | 5th Grade |
| Marshallese | 61.2 /100 | #160 | Good 97.4% |
| Kenyans | 59.7 /100 | #161 | Average 97.4% |
| Immigrants | Iran | 59.5 /100 | #162 | Average 97.4% |
| Ugandans | 58.9 /100 | #163 | Average 97.4% |
| Bermudans | 58.8 /100 | #164 | Average 97.4% |
| Immigrants | Poland | 57.9 /100 | #165 | Average 97.4% |
| Apache | 57.2 /100 | #166 | Average 97.4% |
| Immigrants | Belarus | 54.6 /100 | #167 | Average 97.3% |
| Chileans | 54.5 /100 | #168 | Average 97.3% |
| Immigrants | Korea | 54.1 /100 | #169 | Average 97.3% |
| Venezuelans | 54.0 /100 | #170 | Average 97.3% |
| Immigrants | Sri Lanka | 53.8 /100 | #171 | Average 97.3% |
| Arabs | 53.4 /100 | #172 | Average 97.3% |
| Egyptians | 52.4 /100 | #173 | Average 97.3% |
| Immigrants | Kazakhstan | 50.0 /100 | #174 | Average 97.3% |
Demographics Similar to Costa Ricans by 5th Grade
In terms of 5th grade, the demographic groups most similar to Costa Ricans are Portuguese (97.1%, a difference of 0.0%), Immigrants from Morocco (97.1%, a difference of 0.0%), Samoan (97.1%, a difference of 0.010%), Immigrants from Iraq (97.1%, a difference of 0.010%), and Sudanese (97.1%, a difference of 0.010%).
| Demographics | Rating | Rank | 5th Grade |
| Iraqis | 10.9 /100 | #207 | Poor 97.1% |
| Laotians | 10.8 /100 | #208 | Poor 97.1% |
| Immigrants | Nepal | 10.3 /100 | #209 | Poor 97.1% |
| Immigrants | Oceania | 10.0 /100 | #210 | Poor 97.1% |
| Samoans | 8.5 /100 | #211 | Tragic 97.1% |
| Immigrants | Iraq | 8.3 /100 | #212 | Tragic 97.1% |
| Portuguese | 7.8 /100 | #213 | Tragic 97.1% |
| Costa Ricans | 7.7 /100 | #214 | Tragic 97.1% |
| Immigrants | Morocco | 7.5 /100 | #215 | Tragic 97.1% |
| Sudanese | 7.0 /100 | #216 | Tragic 97.1% |
| Immigrants | Lebanon | 6.8 /100 | #217 | Tragic 97.1% |
| Immigrants | Sudan | 6.5 /100 | #218 | Tragic 97.1% |
| Immigrants | Syria | 6.4 /100 | #219 | Tragic 97.1% |
| Immigrants | Southern Europe | 6.3 /100 | #220 | Tragic 97.1% |
| Sierra Leoneans | 6.0 /100 | #221 | Tragic 97.1% |