Immigrants from the Azores vs Yuman 3rd Grade
COMPARE
Immigrants from the Azores
Yuman
3rd Grade
3rd Grade Comparison
Immigrants from the Azores
Yuman
96.6%
3RD GRADE
0.0/ 100
METRIC RATING
315th/ 347
METRIC RANK
97.6%
3RD GRADE
8.4/ 100
METRIC RATING
214th/ 347
METRIC RANK
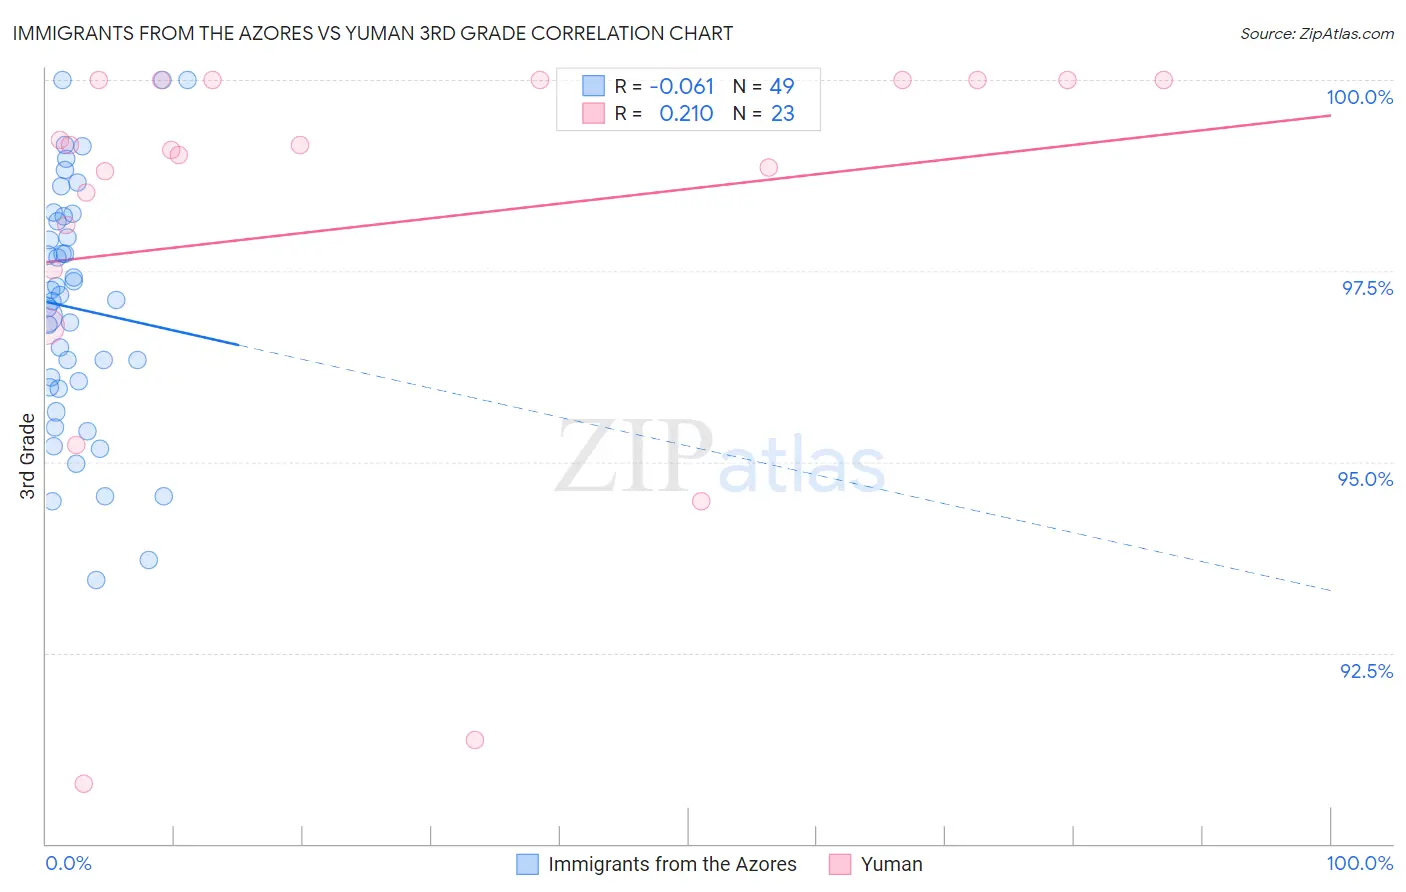
Immigrants from the Azores vs Yuman 3rd Grade Correlation Chart
The statistical analysis conducted on geographies consisting of 46,257,310 people shows a slight negative correlation between the proportion of Immigrants from the Azores and percentage of population with at least 3rd grade education in the United States with a correlation coefficient (R) of -0.061 and weighted average of 96.6%. Similarly, the statistical analysis conducted on geographies consisting of 40,696,349 people shows a weak positive correlation between the proportion of Yuman and percentage of population with at least 3rd grade education in the United States with a correlation coefficient (R) of 0.210 and weighted average of 97.6%, a difference of 1.0%.
3rd Grade Correlation Summary
| Measurement | Immigrants from the Azores | Yuman |
| Minimum | 93.4% | 90.8% |
| Maximum | 100.0% | 100.0% |
| Range | 6.6% | 9.2% |
| Mean | 97.0% | 98.1% |
| Median | 97.1% | 99.1% |
| Interquartile 25% (IQ1) | 96.0% | 97.5% |
| Interquartile 75% (IQ3) | 98.2% | 100.0% |
| Interquartile Range (IQR) | 2.2% | 2.5% |
| Standard Deviation (Sample) | 1.6% | 2.7% |
| Standard Deviation (Population) | 1.6% | 2.6% |
Similar Demographics by 3rd Grade
Demographics Similar to Immigrants from the Azores by 3rd Grade
In terms of 3rd grade, the demographic groups most similar to Immigrants from the Azores are Immigrants from Ecuador (96.6%, a difference of 0.010%), Belizean (96.6%, a difference of 0.010%), Immigrants from Burma/Myanmar (96.6%, a difference of 0.010%), Immigrants from Laos (96.6%, a difference of 0.020%), and Immigrants from Bangladesh (96.6%, a difference of 0.030%).
| Demographics | Rating | Rank | 3rd Grade |
| Immigrants | Haiti | 0.0 /100 | #308 | Tragic 96.7% |
| Sri Lankans | 0.0 /100 | #309 | Tragic 96.7% |
| Cape Verdeans | 0.0 /100 | #310 | Tragic 96.6% |
| Immigrants | Guyana | 0.0 /100 | #311 | Tragic 96.6% |
| Immigrants | Laos | 0.0 /100 | #312 | Tragic 96.6% |
| Immigrants | Ecuador | 0.0 /100 | #313 | Tragic 96.6% |
| Belizeans | 0.0 /100 | #314 | Tragic 96.6% |
| Immigrants | Azores | 0.0 /100 | #315 | Tragic 96.6% |
| Immigrants | Burma/Myanmar | 0.0 /100 | #316 | Tragic 96.6% |
| Immigrants | Bangladesh | 0.0 /100 | #317 | Tragic 96.6% |
| Hispanics or Latinos | 0.0 /100 | #318 | Tragic 96.5% |
| Vietnamese | 0.0 /100 | #319 | Tragic 96.5% |
| Immigrants | Nicaragua | 0.0 /100 | #320 | Tragic 96.5% |
| Indonesians | 0.0 /100 | #321 | Tragic 96.5% |
| Immigrants | Belize | 0.0 /100 | #322 | Tragic 96.5% |
Demographics Similar to Yuman by 3rd Grade
In terms of 3rd grade, the demographic groups most similar to Yuman are Immigrants from Bahamas (97.6%, a difference of 0.0%), Moroccan (97.6%, a difference of 0.0%), Costa Rican (97.6%, a difference of 0.010%), Immigrants from Oceania (97.6%, a difference of 0.010%), and Laotian (97.6%, a difference of 0.010%).
| Demographics | Rating | Rank | 3rd Grade |
| Tohono O'odham | 12.5 /100 | #207 | Poor 97.6% |
| Immigrants | Zaire | 11.9 /100 | #208 | Poor 97.6% |
| Costa Ricans | 9.6 /100 | #209 | Tragic 97.6% |
| Immigrants | Oceania | 9.5 /100 | #210 | Tragic 97.6% |
| Laotians | 9.4 /100 | #211 | Tragic 97.6% |
| Immigrants | Bahamas | 8.5 /100 | #212 | Tragic 97.6% |
| Moroccans | 8.5 /100 | #213 | Tragic 97.6% |
| Yuman | 8.4 /100 | #214 | Tragic 97.6% |
| Iraqis | 6.9 /100 | #215 | Tragic 97.5% |
| Samoans | 6.9 /100 | #216 | Tragic 97.5% |
| South American Indians | 5.7 /100 | #217 | Tragic 97.5% |
| Immigrants | Nepal | 5.3 /100 | #218 | Tragic 97.5% |
| Immigrants | Panama | 5.2 /100 | #219 | Tragic 97.5% |
| Immigrants | Morocco | 5.0 /100 | #220 | Tragic 97.5% |
| Uruguayans | 5.0 /100 | #221 | Tragic 97.5% |