Alsatian vs Yuman 3rd Grade
COMPARE
Alsatian
Yuman
3rd Grade
3rd Grade Comparison
Alsatians
Yuman
97.9%
3RD GRADE
78.3/ 100
METRIC RATING
146th/ 347
METRIC RANK
97.6%
3RD GRADE
8.4/ 100
METRIC RATING
214th/ 347
METRIC RANK
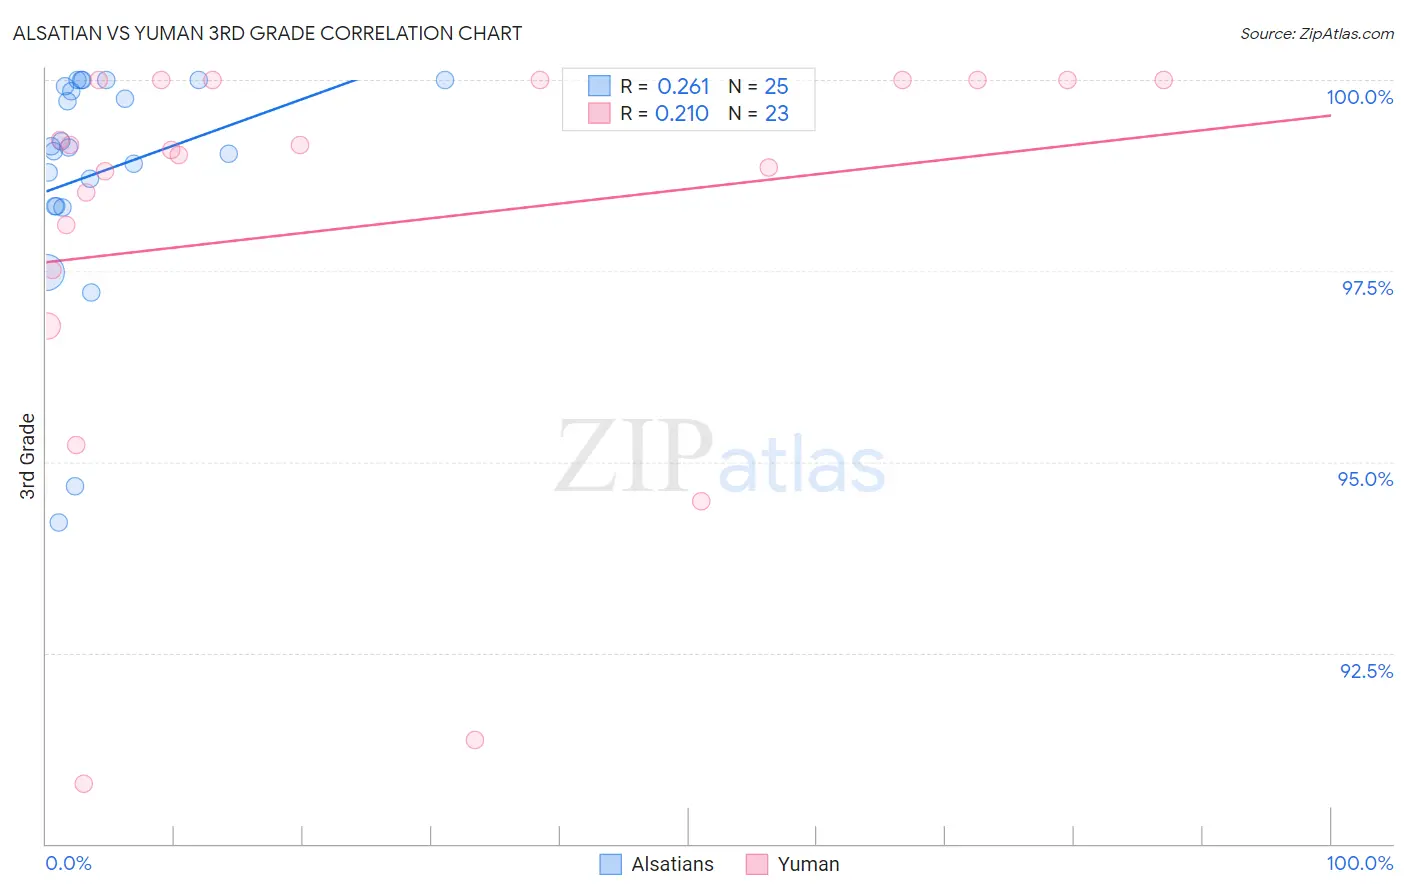
Alsatian vs Yuman 3rd Grade Correlation Chart
The statistical analysis conducted on geographies consisting of 82,682,365 people shows a weak positive correlation between the proportion of Alsatians and percentage of population with at least 3rd grade education in the United States with a correlation coefficient (R) of 0.261 and weighted average of 97.9%. Similarly, the statistical analysis conducted on geographies consisting of 40,696,349 people shows a weak positive correlation between the proportion of Yuman and percentage of population with at least 3rd grade education in the United States with a correlation coefficient (R) of 0.210 and weighted average of 97.6%, a difference of 0.31%.
3rd Grade Correlation Summary
| Measurement | Alsatian | Yuman |
| Minimum | 94.2% | 90.8% |
| Maximum | 100.0% | 100.0% |
| Range | 5.8% | 9.2% |
| Mean | 98.8% | 98.1% |
| Median | 99.1% | 99.1% |
| Interquartile 25% (IQ1) | 98.3% | 97.5% |
| Interquartile 75% (IQ3) | 100.0% | 100.0% |
| Interquartile Range (IQR) | 1.6% | 2.5% |
| Standard Deviation (Sample) | 1.5% | 2.7% |
| Standard Deviation (Population) | 1.5% | 2.6% |
Similar Demographics by 3rd Grade
Demographics Similar to Alsatians by 3rd Grade
In terms of 3rd grade, the demographic groups most similar to Alsatians are Immigrants from Israel (97.9%, a difference of 0.0%), Hmong (97.9%, a difference of 0.010%), Filipino (97.9%, a difference of 0.010%), Burmese (97.9%, a difference of 0.010%), and Immigrants from Greece (97.9%, a difference of 0.010%).
| Demographics | Rating | Rank | 3rd Grade |
| Blackfeet | 86.3 /100 | #139 | Excellent 97.9% |
| Palestinians | 84.6 /100 | #140 | Excellent 97.9% |
| Immigrants | Turkey | 83.5 /100 | #141 | Excellent 97.9% |
| Hmong | 80.3 /100 | #142 | Excellent 97.9% |
| Filipinos | 79.9 /100 | #143 | Good 97.9% |
| Burmese | 79.6 /100 | #144 | Good 97.9% |
| Immigrants | Greece | 79.5 /100 | #145 | Good 97.9% |
| Alsatians | 78.3 /100 | #146 | Good 97.9% |
| Immigrants | Israel | 77.3 /100 | #147 | Good 97.9% |
| Immigrants | Moldova | 77.1 /100 | #148 | Good 97.9% |
| Immigrants | North Macedonia | 74.5 /100 | #149 | Good 97.8% |
| Jordanians | 74.5 /100 | #150 | Good 97.8% |
| Soviet Union | 72.6 /100 | #151 | Good 97.8% |
| Immigrants | South Central Asia | 69.5 /100 | #152 | Good 97.8% |
| Apache | 68.5 /100 | #153 | Good 97.8% |
Demographics Similar to Yuman by 3rd Grade
In terms of 3rd grade, the demographic groups most similar to Yuman are Immigrants from Bahamas (97.6%, a difference of 0.0%), Moroccan (97.6%, a difference of 0.0%), Costa Rican (97.6%, a difference of 0.010%), Immigrants from Oceania (97.6%, a difference of 0.010%), and Laotian (97.6%, a difference of 0.010%).
| Demographics | Rating | Rank | 3rd Grade |
| Tohono O'odham | 12.5 /100 | #207 | Poor 97.6% |
| Immigrants | Zaire | 11.9 /100 | #208 | Poor 97.6% |
| Costa Ricans | 9.6 /100 | #209 | Tragic 97.6% |
| Immigrants | Oceania | 9.5 /100 | #210 | Tragic 97.6% |
| Laotians | 9.4 /100 | #211 | Tragic 97.6% |
| Immigrants | Bahamas | 8.5 /100 | #212 | Tragic 97.6% |
| Moroccans | 8.5 /100 | #213 | Tragic 97.6% |
| Yuman | 8.4 /100 | #214 | Tragic 97.6% |
| Iraqis | 6.9 /100 | #215 | Tragic 97.5% |
| Samoans | 6.9 /100 | #216 | Tragic 97.5% |
| South American Indians | 5.7 /100 | #217 | Tragic 97.5% |
| Immigrants | Nepal | 5.3 /100 | #218 | Tragic 97.5% |
| Immigrants | Panama | 5.2 /100 | #219 | Tragic 97.5% |
| Immigrants | Morocco | 5.0 /100 | #220 | Tragic 97.5% |
| Uruguayans | 5.0 /100 | #221 | Tragic 97.5% |