Immigrants from Austria vs Potawatomi Associate's Degree
COMPARE
Immigrants from Austria
Potawatomi
Associate's Degree
Associate's Degree Comparison
Immigrants from Austria
Potawatomi
52.1%
ASSOCIATE'S DEGREE
99.9/ 100
METRIC RATING
49th/ 347
METRIC RANK
40.4%
ASSOCIATE'S DEGREE
0.1/ 100
METRIC RATING
275th/ 347
METRIC RANK
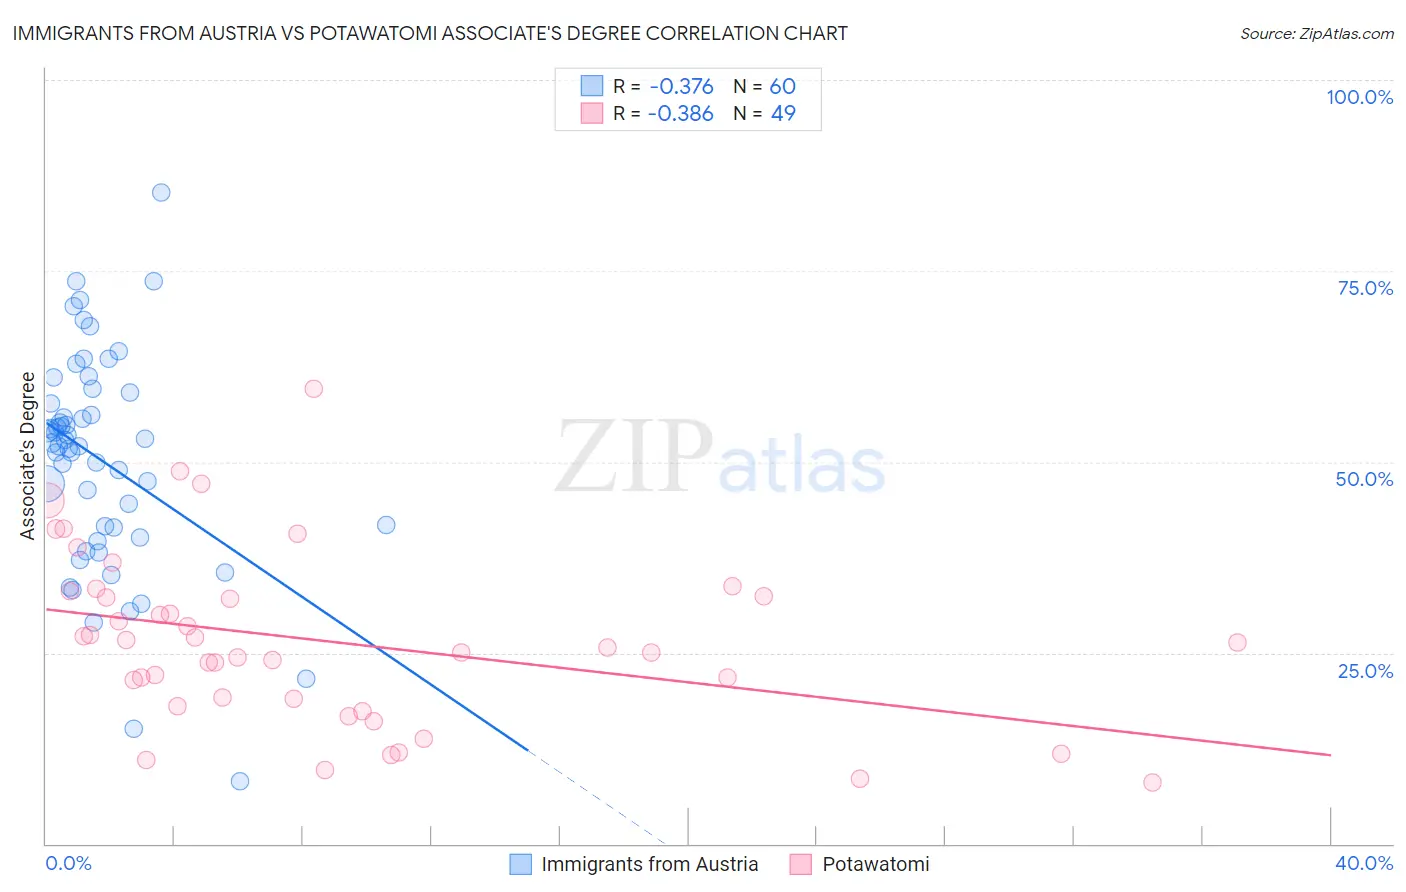
Immigrants from Austria vs Potawatomi Associate's Degree Correlation Chart
The statistical analysis conducted on geographies consisting of 167,971,732 people shows a mild negative correlation between the proportion of Immigrants from Austria and percentage of population with at least associate's degree education in the United States with a correlation coefficient (R) of -0.376 and weighted average of 52.1%. Similarly, the statistical analysis conducted on geographies consisting of 117,773,349 people shows a mild negative correlation between the proportion of Potawatomi and percentage of population with at least associate's degree education in the United States with a correlation coefficient (R) of -0.386 and weighted average of 40.4%, a difference of 29.0%.
Associate's Degree Correlation Summary
| Measurement | Immigrants from Austria | Potawatomi |
| Minimum | 8.2% | 8.0% |
| Maximum | 85.3% | 59.6% |
| Range | 77.1% | 51.6% |
| Mean | 50.1% | 26.5% |
| Median | 52.3% | 25.7% |
| Interquartile 25% (IQ1) | 40.8% | 18.5% |
| Interquartile 75% (IQ3) | 58.4% | 32.7% |
| Interquartile Range (IQR) | 17.6% | 14.3% |
| Standard Deviation (Sample) | 14.4% | 11.3% |
| Standard Deviation (Population) | 14.3% | 11.2% |
Similar Demographics by Associate's Degree
Demographics Similar to Immigrants from Austria by Associate's Degree
In terms of associate's degree, the demographic groups most similar to Immigrants from Austria are Asian (52.1%, a difference of 0.010%), Immigrants from Greece (52.1%, a difference of 0.10%), Immigrants from Norway (52.2%, a difference of 0.20%), Bolivian (52.0%, a difference of 0.30%), and Immigrants from Asia (52.0%, a difference of 0.33%).
| Demographics | Rating | Rank | Associate's Degree |
| Immigrants | Malaysia | 99.9 /100 | #42 | Exceptional 52.5% |
| Immigrants | South Africa | 99.9 /100 | #43 | Exceptional 52.5% |
| Estonians | 99.9 /100 | #44 | Exceptional 52.5% |
| Immigrants | Lithuania | 99.9 /100 | #45 | Exceptional 52.4% |
| Immigrants | Bulgaria | 99.9 /100 | #46 | Exceptional 52.4% |
| Immigrants | Kuwait | 99.9 /100 | #47 | Exceptional 52.4% |
| Immigrants | Norway | 99.9 /100 | #48 | Exceptional 52.2% |
| Immigrants | Austria | 99.9 /100 | #49 | Exceptional 52.1% |
| Asians | 99.9 /100 | #50 | Exceptional 52.1% |
| Immigrants | Greece | 99.9 /100 | #51 | Exceptional 52.1% |
| Bolivians | 99.8 /100 | #52 | Exceptional 52.0% |
| Immigrants | Asia | 99.8 /100 | #53 | Exceptional 52.0% |
| Immigrants | Spain | 99.8 /100 | #54 | Exceptional 51.9% |
| Australians | 99.8 /100 | #55 | Exceptional 51.9% |
| Immigrants | Czechoslovakia | 99.8 /100 | #56 | Exceptional 51.9% |
Demographics Similar to Potawatomi by Associate's Degree
In terms of associate's degree, the demographic groups most similar to Potawatomi are Puerto Rican (40.4%, a difference of 0.10%), Immigrants from Dominica (40.5%, a difference of 0.14%), Blackfeet (40.3%, a difference of 0.16%), Puget Sound Salish (40.5%, a difference of 0.28%), and Ottawa (40.3%, a difference of 0.30%).
| Demographics | Rating | Rank | Associate's Degree |
| Central American Indians | 0.2 /100 | #268 | Tragic 40.8% |
| Americans | 0.2 /100 | #269 | Tragic 40.8% |
| Chippewa | 0.2 /100 | #270 | Tragic 40.7% |
| Immigrants | Laos | 0.1 /100 | #271 | Tragic 40.7% |
| Belizeans | 0.1 /100 | #272 | Tragic 40.6% |
| Puget Sound Salish | 0.1 /100 | #273 | Tragic 40.5% |
| Immigrants | Dominica | 0.1 /100 | #274 | Tragic 40.5% |
| Potawatomi | 0.1 /100 | #275 | Tragic 40.4% |
| Puerto Ricans | 0.1 /100 | #276 | Tragic 40.4% |
| Blackfeet | 0.1 /100 | #277 | Tragic 40.3% |
| Ottawa | 0.1 /100 | #278 | Tragic 40.3% |
| Immigrants | Nicaragua | 0.1 /100 | #279 | Tragic 40.3% |
| Immigrants | Micronesia | 0.1 /100 | #280 | Tragic 40.2% |
| Immigrants | Portugal | 0.1 /100 | #281 | Tragic 40.1% |
| Bangladeshis | 0.1 /100 | #282 | Tragic 40.0% |