Immigrants from Austria vs Honduran Associate's Degree
COMPARE
Immigrants from Austria
Honduran
Associate's Degree
Associate's Degree Comparison
Immigrants from Austria
Hondurans
52.1%
ASSOCIATE'S DEGREE
99.9/ 100
METRIC RATING
49th/ 347
METRIC RANK
38.9%
ASSOCIATE'S DEGREE
0.0/ 100
METRIC RATING
295th/ 347
METRIC RANK
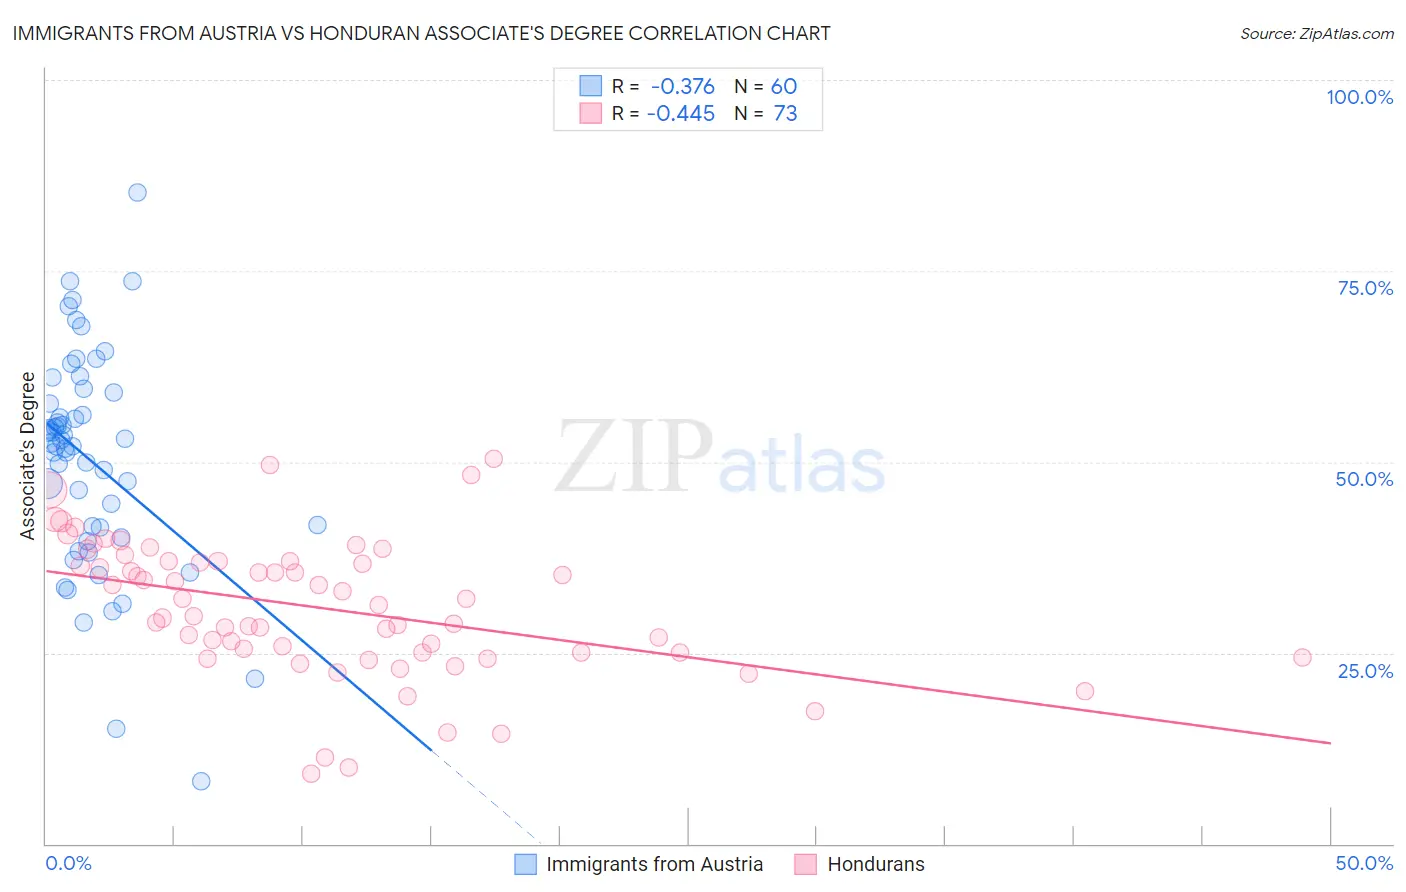
Immigrants from Austria vs Honduran Associate's Degree Correlation Chart
The statistical analysis conducted on geographies consisting of 167,971,732 people shows a mild negative correlation between the proportion of Immigrants from Austria and percentage of population with at least associate's degree education in the United States with a correlation coefficient (R) of -0.376 and weighted average of 52.1%. Similarly, the statistical analysis conducted on geographies consisting of 357,791,704 people shows a moderate negative correlation between the proportion of Hondurans and percentage of population with at least associate's degree education in the United States with a correlation coefficient (R) of -0.445 and weighted average of 38.9%, a difference of 33.9%.
Associate's Degree Correlation Summary
| Measurement | Immigrants from Austria | Honduran |
| Minimum | 8.2% | 9.2% |
| Maximum | 85.3% | 50.4% |
| Range | 77.1% | 41.1% |
| Mean | 50.1% | 30.9% |
| Median | 52.3% | 31.2% |
| Interquartile 25% (IQ1) | 40.8% | 25.1% |
| Interquartile 75% (IQ3) | 58.4% | 36.9% |
| Interquartile Range (IQR) | 17.6% | 11.9% |
| Standard Deviation (Sample) | 14.4% | 8.9% |
| Standard Deviation (Population) | 14.3% | 8.9% |
Similar Demographics by Associate's Degree
Demographics Similar to Immigrants from Austria by Associate's Degree
In terms of associate's degree, the demographic groups most similar to Immigrants from Austria are Asian (52.1%, a difference of 0.010%), Immigrants from Greece (52.1%, a difference of 0.10%), Immigrants from Norway (52.2%, a difference of 0.20%), Bolivian (52.0%, a difference of 0.30%), and Immigrants from Asia (52.0%, a difference of 0.33%).
| Demographics | Rating | Rank | Associate's Degree |
| Immigrants | Malaysia | 99.9 /100 | #42 | Exceptional 52.5% |
| Immigrants | South Africa | 99.9 /100 | #43 | Exceptional 52.5% |
| Estonians | 99.9 /100 | #44 | Exceptional 52.5% |
| Immigrants | Lithuania | 99.9 /100 | #45 | Exceptional 52.4% |
| Immigrants | Bulgaria | 99.9 /100 | #46 | Exceptional 52.4% |
| Immigrants | Kuwait | 99.9 /100 | #47 | Exceptional 52.4% |
| Immigrants | Norway | 99.9 /100 | #48 | Exceptional 52.2% |
| Immigrants | Austria | 99.9 /100 | #49 | Exceptional 52.1% |
| Asians | 99.9 /100 | #50 | Exceptional 52.1% |
| Immigrants | Greece | 99.9 /100 | #51 | Exceptional 52.1% |
| Bolivians | 99.8 /100 | #52 | Exceptional 52.0% |
| Immigrants | Asia | 99.8 /100 | #53 | Exceptional 52.0% |
| Immigrants | Spain | 99.8 /100 | #54 | Exceptional 51.9% |
| Australians | 99.8 /100 | #55 | Exceptional 51.9% |
| Immigrants | Czechoslovakia | 99.8 /100 | #56 | Exceptional 51.9% |
Demographics Similar to Hondurans by Associate's Degree
In terms of associate's degree, the demographic groups most similar to Hondurans are Cherokee (38.9%, a difference of 0.17%), Nepalese (39.0%, a difference of 0.29%), Salvadoran (39.0%, a difference of 0.29%), Cape Verdean (38.8%, a difference of 0.45%), and Black/African American (39.1%, a difference of 0.54%).
| Demographics | Rating | Rank | Associate's Degree |
| Immigrants | Cuba | 0.0 /100 | #288 | Tragic 39.5% |
| Central Americans | 0.0 /100 | #289 | Tragic 39.4% |
| Immigrants | Haiti | 0.0 /100 | #290 | Tragic 39.3% |
| Dominicans | 0.0 /100 | #291 | Tragic 39.3% |
| Blacks/African Americans | 0.0 /100 | #292 | Tragic 39.1% |
| Nepalese | 0.0 /100 | #293 | Tragic 39.0% |
| Salvadorans | 0.0 /100 | #294 | Tragic 39.0% |
| Hondurans | 0.0 /100 | #295 | Tragic 38.9% |
| Cherokee | 0.0 /100 | #296 | Tragic 38.9% |
| Cape Verdeans | 0.0 /100 | #297 | Tragic 38.8% |
| Cheyenne | 0.0 /100 | #298 | Tragic 38.7% |
| Ute | 0.0 /100 | #299 | Tragic 38.6% |
| Chickasaw | 0.0 /100 | #300 | Tragic 38.6% |
| Tsimshian | 0.0 /100 | #301 | Tragic 38.6% |
| Colville | 0.0 /100 | #302 | Tragic 38.5% |