Immigrants from Austria vs Lebanese 3rd Grade
COMPARE
Immigrants from Austria
Lebanese
3rd Grade
3rd Grade Comparison
Immigrants from Austria
Lebanese
98.2%
3RD GRADE
99.6/ 100
METRIC RATING
71st/ 347
METRIC RANK
98.0%
3RD GRADE
94.1/ 100
METRIC RATING
122nd/ 347
METRIC RANK
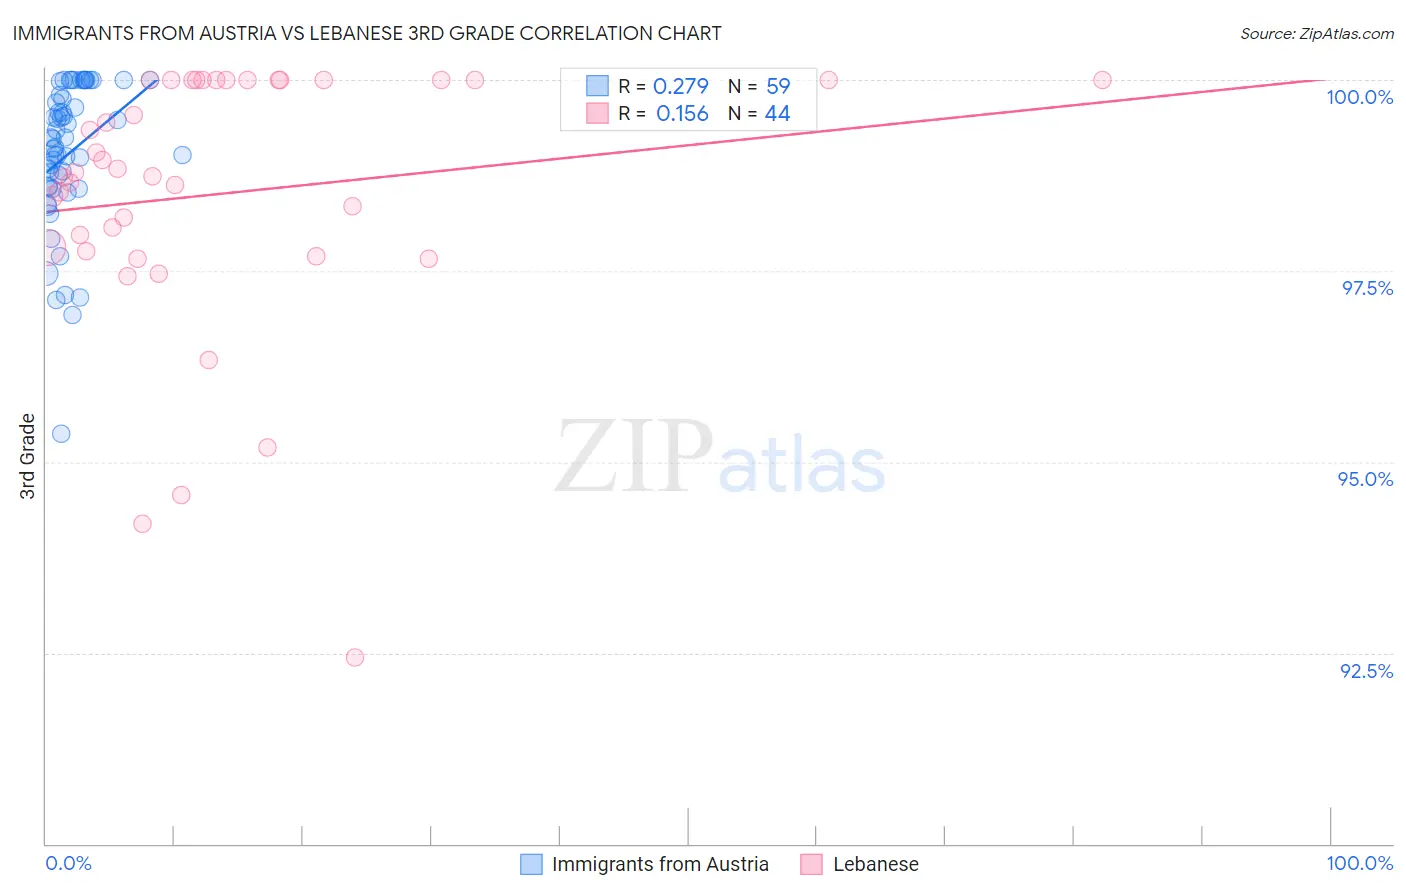
Immigrants from Austria vs Lebanese 3rd Grade Correlation Chart
The statistical analysis conducted on geographies consisting of 167,973,800 people shows a weak positive correlation between the proportion of Immigrants from Austria and percentage of population with at least 3rd grade education in the United States with a correlation coefficient (R) of 0.279 and weighted average of 98.2%. Similarly, the statistical analysis conducted on geographies consisting of 401,624,157 people shows a poor positive correlation between the proportion of Lebanese and percentage of population with at least 3rd grade education in the United States with a correlation coefficient (R) of 0.156 and weighted average of 98.0%, a difference of 0.22%.
3rd Grade Correlation Summary
| Measurement | Immigrants from Austria | Lebanese |
| Minimum | 95.4% | 92.4% |
| Maximum | 100.0% | 100.0% |
| Range | 4.6% | 7.6% |
| Mean | 99.0% | 98.5% |
| Median | 99.2% | 98.8% |
| Interquartile 25% (IQ1) | 98.6% | 97.8% |
| Interquartile 75% (IQ3) | 99.8% | 100.0% |
| Interquartile Range (IQR) | 1.2% | 2.2% |
| Standard Deviation (Sample) | 0.96% | 1.7% |
| Standard Deviation (Population) | 0.95% | 1.7% |
Similar Demographics by 3rd Grade
Demographics Similar to Immigrants from Austria by 3rd Grade
In terms of 3rd grade, the demographic groups most similar to Immigrants from Austria are Chickasaw (98.2%, a difference of 0.0%), New Zealander (98.2%, a difference of 0.010%), Serbian (98.2%, a difference of 0.010%), Russian (98.2%, a difference of 0.010%), and Immigrants from Northern Europe (98.2%, a difference of 0.010%).
| Demographics | Rating | Rank | 3rd Grade |
| Kiowa | 99.6 /100 | #64 | Exceptional 98.2% |
| New Zealanders | 99.6 /100 | #65 | Exceptional 98.2% |
| Serbians | 99.6 /100 | #66 | Exceptional 98.2% |
| Russians | 99.6 /100 | #67 | Exceptional 98.2% |
| Immigrants | Northern Europe | 99.6 /100 | #68 | Exceptional 98.2% |
| Canadians | 99.6 /100 | #69 | Exceptional 98.2% |
| Cajuns | 99.6 /100 | #70 | Exceptional 98.2% |
| Immigrants | Austria | 99.6 /100 | #71 | Exceptional 98.2% |
| Chickasaw | 99.5 /100 | #72 | Exceptional 98.2% |
| Cheyenne | 99.3 /100 | #73 | Exceptional 98.2% |
| Immigrants | Netherlands | 99.3 /100 | #74 | Exceptional 98.2% |
| Cherokee | 99.3 /100 | #75 | Exceptional 98.2% |
| Immigrants | England | 99.2 /100 | #76 | Exceptional 98.2% |
| Immigrants | Lithuania | 99.2 /100 | #77 | Exceptional 98.2% |
| Osage | 99.2 /100 | #78 | Exceptional 98.2% |
Demographics Similar to Lebanese by 3rd Grade
In terms of 3rd grade, the demographic groups most similar to Lebanese are Immigrants from Croatia (98.0%, a difference of 0.0%), Iroquois (98.0%, a difference of 0.0%), Iranian (98.0%, a difference of 0.010%), Spanish (98.0%, a difference of 0.010%), and Syrian (98.0%, a difference of 0.010%).
| Demographics | Rating | Rank | 3rd Grade |
| Okinawans | 95.2 /100 | #115 | Exceptional 98.0% |
| Immigrants | Norway | 95.2 /100 | #116 | Exceptional 98.0% |
| Immigrants | France | 95.1 /100 | #117 | Exceptional 98.0% |
| Iranians | 94.9 /100 | #118 | Exceptional 98.0% |
| Spanish | 94.8 /100 | #119 | Exceptional 98.0% |
| Immigrants | Croatia | 94.4 /100 | #120 | Exceptional 98.0% |
| Iroquois | 94.1 /100 | #121 | Exceptional 98.0% |
| Lebanese | 94.1 /100 | #122 | Exceptional 98.0% |
| Syrians | 93.8 /100 | #123 | Exceptional 98.0% |
| Immigrants | Japan | 93.7 /100 | #124 | Exceptional 98.0% |
| Immigrants | Saudi Arabia | 93.5 /100 | #125 | Exceptional 98.0% |
| Immigrants | Zimbabwe | 93.4 /100 | #126 | Exceptional 98.0% |
| Ute | 93.2 /100 | #127 | Exceptional 98.0% |
| Colville | 92.1 /100 | #128 | Exceptional 98.0% |
| Immigrants | Serbia | 91.9 /100 | #129 | Exceptional 98.0% |