Immigrants from Albania vs Immigrants from Southern Europe 8th Grade
COMPARE
Immigrants from Albania
Immigrants from Southern Europe
8th Grade
8th Grade Comparison
Immigrants from Albania
Immigrants from Southern Europe
95.7%
8TH GRADE
49.6/ 100
METRIC RATING
175th/ 347
METRIC RANK
95.3%
8TH GRADE
7.7/ 100
METRIC RATING
220th/ 347
METRIC RANK
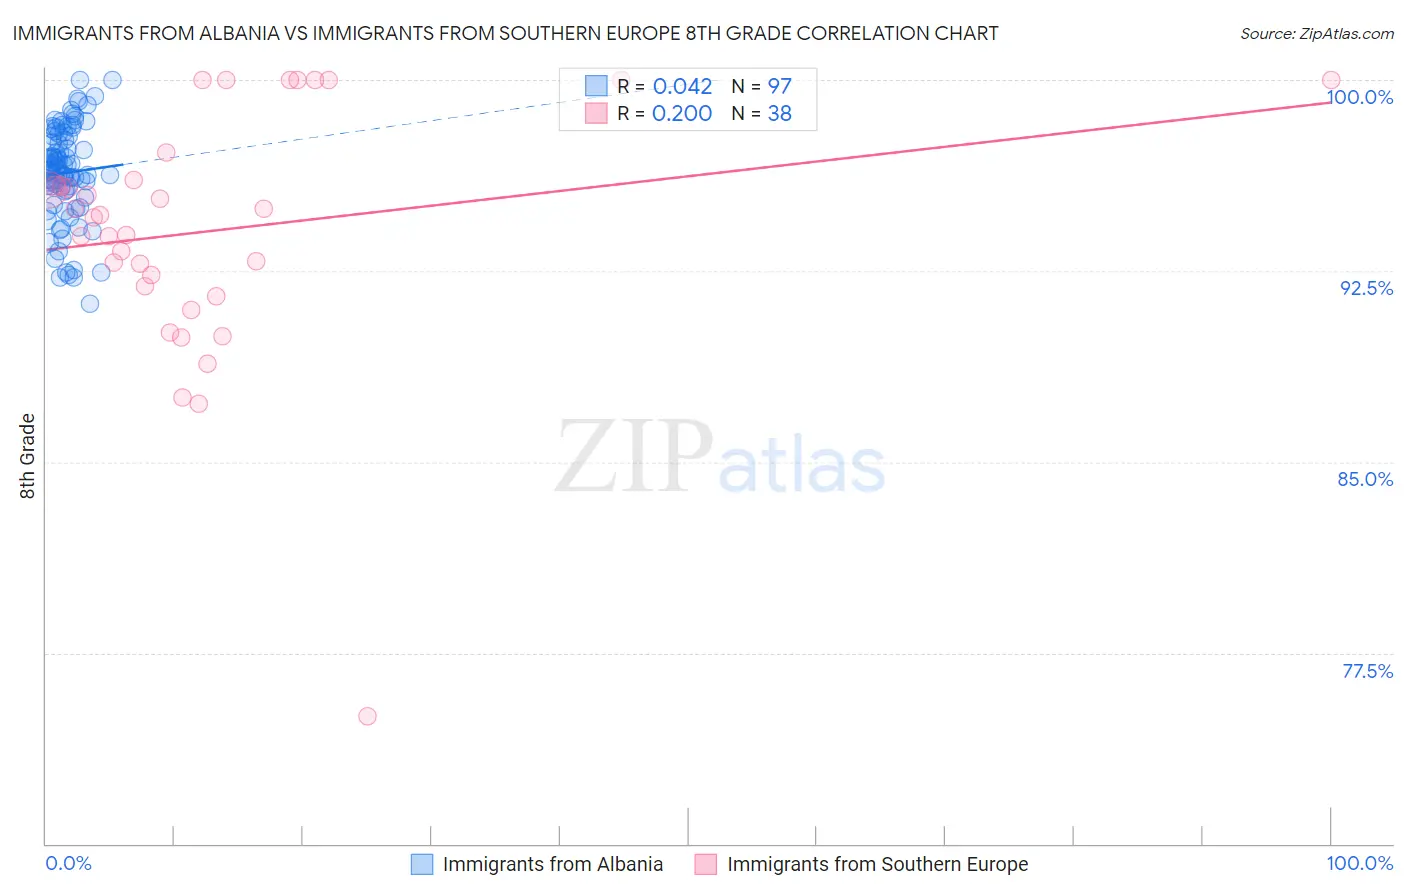
Immigrants from Albania vs Immigrants from Southern Europe 8th Grade Correlation Chart
The statistical analysis conducted on geographies consisting of 119,265,453 people shows no correlation between the proportion of Immigrants from Albania and percentage of population with at least 8th grade education in the United States with a correlation coefficient (R) of 0.042 and weighted average of 95.7%. Similarly, the statistical analysis conducted on geographies consisting of 402,804,595 people shows a weak positive correlation between the proportion of Immigrants from Southern Europe and percentage of population with at least 8th grade education in the United States with a correlation coefficient (R) of 0.200 and weighted average of 95.3%, a difference of 0.40%.
8th Grade Correlation Summary
| Measurement | Immigrants from Albania | Immigrants from Southern Europe |
| Minimum | 91.2% | 75.0% |
| Maximum | 100.0% | 100.0% |
| Range | 8.8% | 25.0% |
| Mean | 96.4% | 94.1% |
| Median | 96.5% | 94.7% |
| Interquartile 25% (IQ1) | 95.7% | 91.9% |
| Interquartile 75% (IQ3) | 97.8% | 96.1% |
| Interquartile Range (IQR) | 2.1% | 4.2% |
| Standard Deviation (Sample) | 1.9% | 4.9% |
| Standard Deviation (Population) | 1.9% | 4.8% |
Similar Demographics by 8th Grade
Demographics Similar to Immigrants from Albania by 8th Grade
In terms of 8th grade, the demographic groups most similar to Immigrants from Albania are Chilean (95.7%, a difference of 0.0%), Pakistani (95.7%, a difference of 0.010%), Marshallese (95.7%, a difference of 0.010%), Venezuelan (95.7%, a difference of 0.010%), and Mongolian (95.8%, a difference of 0.020%).
| Demographics | Rating | Rank | 8th Grade |
| Immigrants | Ukraine | 59.5 /100 | #168 | Average 95.8% |
| Immigrants | Iran | 58.6 /100 | #169 | Average 95.8% |
| Ute | 58.5 /100 | #170 | Average 95.8% |
| Egyptians | 58.2 /100 | #171 | Average 95.8% |
| Immigrants | Korea | 57.9 /100 | #172 | Average 95.8% |
| Mongolians | 53.0 /100 | #173 | Average 95.8% |
| Chileans | 50.0 /100 | #174 | Average 95.7% |
| Immigrants | Albania | 49.6 /100 | #175 | Average 95.7% |
| Pakistanis | 48.8 /100 | #176 | Average 95.7% |
| Marshallese | 47.6 /100 | #177 | Average 95.7% |
| Venezuelans | 47.5 /100 | #178 | Average 95.7% |
| Immigrants | Brazil | 45.4 /100 | #179 | Average 95.7% |
| Iraqis | 40.5 /100 | #180 | Average 95.7% |
| Immigrants | Spain | 38.7 /100 | #181 | Fair 95.7% |
| Immigrants | Egypt | 37.9 /100 | #182 | Fair 95.7% |
Demographics Similar to Immigrants from Southern Europe by 8th Grade
In terms of 8th grade, the demographic groups most similar to Immigrants from Southern Europe are Immigrants from Eastern Asia (95.4%, a difference of 0.010%), Dutch West Indian (95.4%, a difference of 0.010%), Spanish American (95.4%, a difference of 0.010%), Immigrants from Syria (95.3%, a difference of 0.010%), and Immigrants from Malaysia (95.3%, a difference of 0.010%).
| Demographics | Rating | Rank | 8th Grade |
| Laotians | 9.0 /100 | #213 | Tragic 95.4% |
| Immigrants | Chile | 9.0 /100 | #214 | Tragic 95.4% |
| Immigrants | Liberia | 8.9 /100 | #215 | Tragic 95.4% |
| Samoans | 8.4 /100 | #216 | Tragic 95.4% |
| Immigrants | Eastern Asia | 8.3 /100 | #217 | Tragic 95.4% |
| Dutch West Indians | 8.1 /100 | #218 | Tragic 95.4% |
| Spanish Americans | 8.0 /100 | #219 | Tragic 95.4% |
| Immigrants | Southern Europe | 7.7 /100 | #220 | Tragic 95.3% |
| Immigrants | Syria | 7.4 /100 | #221 | Tragic 95.3% |
| Immigrants | Malaysia | 7.3 /100 | #222 | Tragic 95.3% |
| Immigrants | Oceania | 7.1 /100 | #223 | Tragic 95.3% |
| Immigrants | Western Asia | 6.0 /100 | #224 | Tragic 95.3% |
| Sub-Saharan Africans | 6.0 /100 | #225 | Tragic 95.3% |
| Navajo | 5.7 /100 | #226 | Tragic 95.3% |
| Bahamians | 5.6 /100 | #227 | Tragic 95.3% |