Guyanese vs Immigrants from Southern Europe 8th Grade
COMPARE
Guyanese
Immigrants from Southern Europe
8th Grade
8th Grade Comparison
Guyanese
Immigrants from Southern Europe
93.9%
8TH GRADE
0.0/ 100
METRIC RATING
304th/ 347
METRIC RANK
95.3%
8TH GRADE
7.7/ 100
METRIC RATING
220th/ 347
METRIC RANK
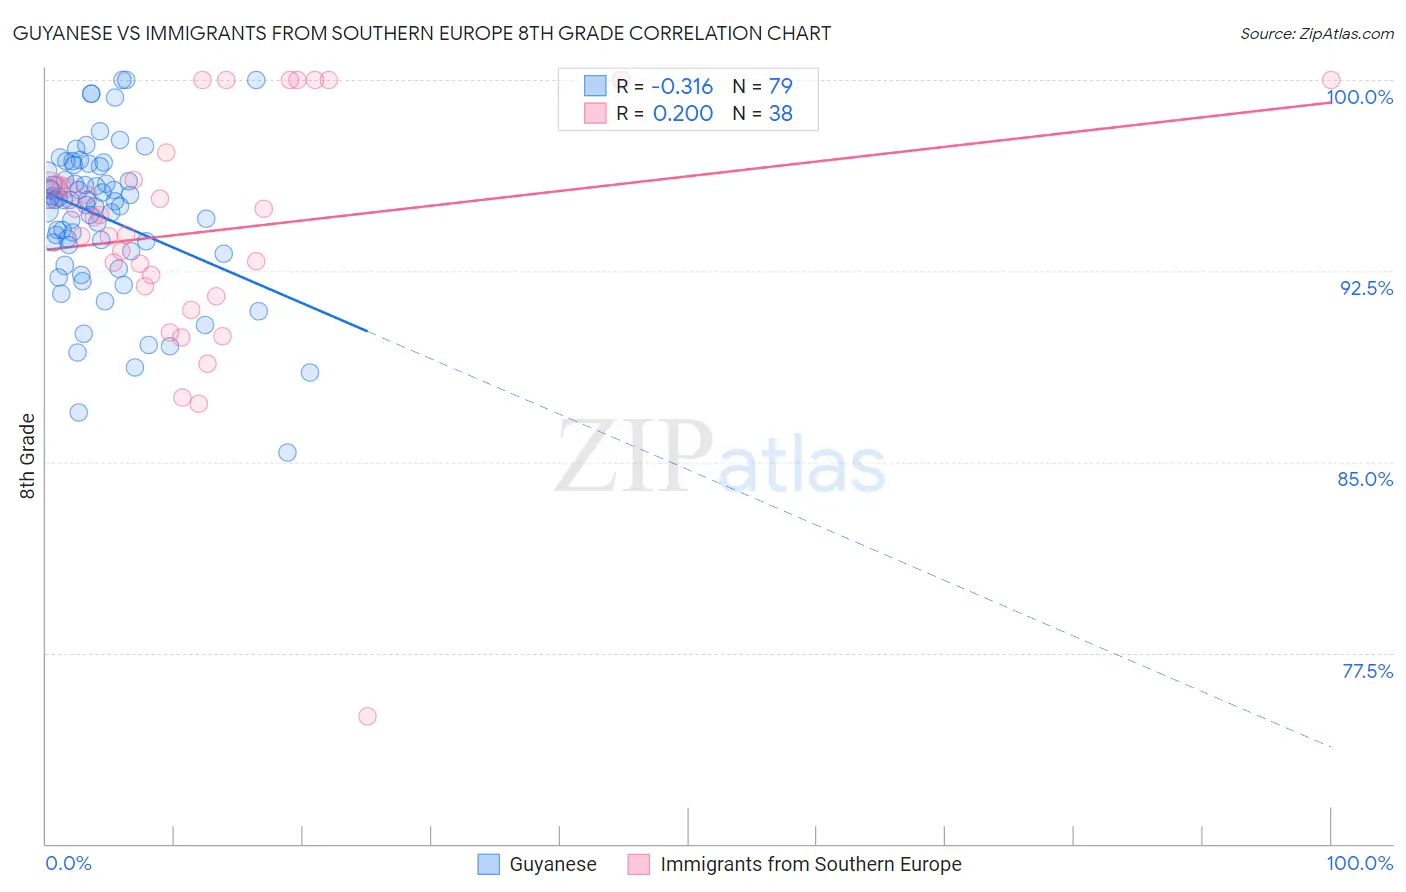
Guyanese vs Immigrants from Southern Europe 8th Grade Correlation Chart
The statistical analysis conducted on geographies consisting of 176,937,226 people shows a mild negative correlation between the proportion of Guyanese and percentage of population with at least 8th grade education in the United States with a correlation coefficient (R) of -0.316 and weighted average of 93.9%. Similarly, the statistical analysis conducted on geographies consisting of 402,804,595 people shows a weak positive correlation between the proportion of Immigrants from Southern Europe and percentage of population with at least 8th grade education in the United States with a correlation coefficient (R) of 0.200 and weighted average of 95.3%, a difference of 1.6%.
8th Grade Correlation Summary
| Measurement | Guyanese | Immigrants from Southern Europe |
| Minimum | 85.4% | 75.0% |
| Maximum | 100.0% | 100.0% |
| Range | 14.6% | 25.0% |
| Mean | 94.6% | 94.1% |
| Median | 95.3% | 94.7% |
| Interquartile 25% (IQ1) | 93.3% | 91.9% |
| Interquartile 75% (IQ3) | 96.4% | 96.1% |
| Interquartile Range (IQR) | 3.1% | 4.2% |
| Standard Deviation (Sample) | 2.9% | 4.9% |
| Standard Deviation (Population) | 2.9% | 4.8% |
Similar Demographics by 8th Grade
Demographics Similar to Guyanese by 8th Grade
In terms of 8th grade, the demographic groups most similar to Guyanese are Immigrants from Haiti (93.9%, a difference of 0.030%), Immigrants from Dominica (94.0%, a difference of 0.080%), Sri Lankan (94.0%, a difference of 0.13%), Immigrants from Guyana (93.8%, a difference of 0.13%), and Immigrants from Portugal (93.8%, a difference of 0.14%).
| Demographics | Rating | Rank | 8th Grade |
| Immigrants | South Eastern Asia | 0.0 /100 | #297 | Tragic 94.2% |
| Indonesians | 0.0 /100 | #298 | Tragic 94.1% |
| Cubans | 0.0 /100 | #299 | Tragic 94.1% |
| Immigrants | Burma/Myanmar | 0.0 /100 | #300 | Tragic 94.1% |
| Immigrants | Laos | 0.0 /100 | #301 | Tragic 94.1% |
| Sri Lankans | 0.0 /100 | #302 | Tragic 94.0% |
| Immigrants | Dominica | 0.0 /100 | #303 | Tragic 94.0% |
| Guyanese | 0.0 /100 | #304 | Tragic 93.9% |
| Immigrants | Haiti | 0.0 /100 | #305 | Tragic 93.9% |
| Immigrants | Guyana | 0.0 /100 | #306 | Tragic 93.8% |
| Immigrants | Portugal | 0.0 /100 | #307 | Tragic 93.8% |
| Ecuadorians | 0.0 /100 | #308 | Tragic 93.6% |
| Immigrants | Immigrants | 0.0 /100 | #309 | Tragic 93.6% |
| Japanese | 0.0 /100 | #310 | Tragic 93.6% |
| Immigrants | Bangladesh | 0.0 /100 | #311 | Tragic 93.6% |
Demographics Similar to Immigrants from Southern Europe by 8th Grade
In terms of 8th grade, the demographic groups most similar to Immigrants from Southern Europe are Immigrants from Eastern Asia (95.4%, a difference of 0.010%), Dutch West Indian (95.4%, a difference of 0.010%), Spanish American (95.4%, a difference of 0.010%), Immigrants from Syria (95.3%, a difference of 0.010%), and Immigrants from Malaysia (95.3%, a difference of 0.010%).
| Demographics | Rating | Rank | 8th Grade |
| Laotians | 9.0 /100 | #213 | Tragic 95.4% |
| Immigrants | Chile | 9.0 /100 | #214 | Tragic 95.4% |
| Immigrants | Liberia | 8.9 /100 | #215 | Tragic 95.4% |
| Samoans | 8.4 /100 | #216 | Tragic 95.4% |
| Immigrants | Eastern Asia | 8.3 /100 | #217 | Tragic 95.4% |
| Dutch West Indians | 8.1 /100 | #218 | Tragic 95.4% |
| Spanish Americans | 8.0 /100 | #219 | Tragic 95.4% |
| Immigrants | Southern Europe | 7.7 /100 | #220 | Tragic 95.3% |
| Immigrants | Syria | 7.4 /100 | #221 | Tragic 95.3% |
| Immigrants | Malaysia | 7.3 /100 | #222 | Tragic 95.3% |
| Immigrants | Oceania | 7.1 /100 | #223 | Tragic 95.3% |
| Immigrants | Western Asia | 6.0 /100 | #224 | Tragic 95.3% |
| Sub-Saharan Africans | 6.0 /100 | #225 | Tragic 95.3% |
| Navajo | 5.7 /100 | #226 | Tragic 95.3% |
| Bahamians | 5.6 /100 | #227 | Tragic 95.3% |