Icelander vs Nonimmigrants 8th Grade
COMPARE
Icelander
Nonimmigrants
8th Grade
8th Grade Comparison
Icelanders
Nonimmigrants
96.5%
8TH GRADE
99.2/ 100
METRIC RATING
83rd/ 347
METRIC RANK
96.2%
8TH GRADE
96.0/ 100
METRIC RATING
116th/ 347
METRIC RANK
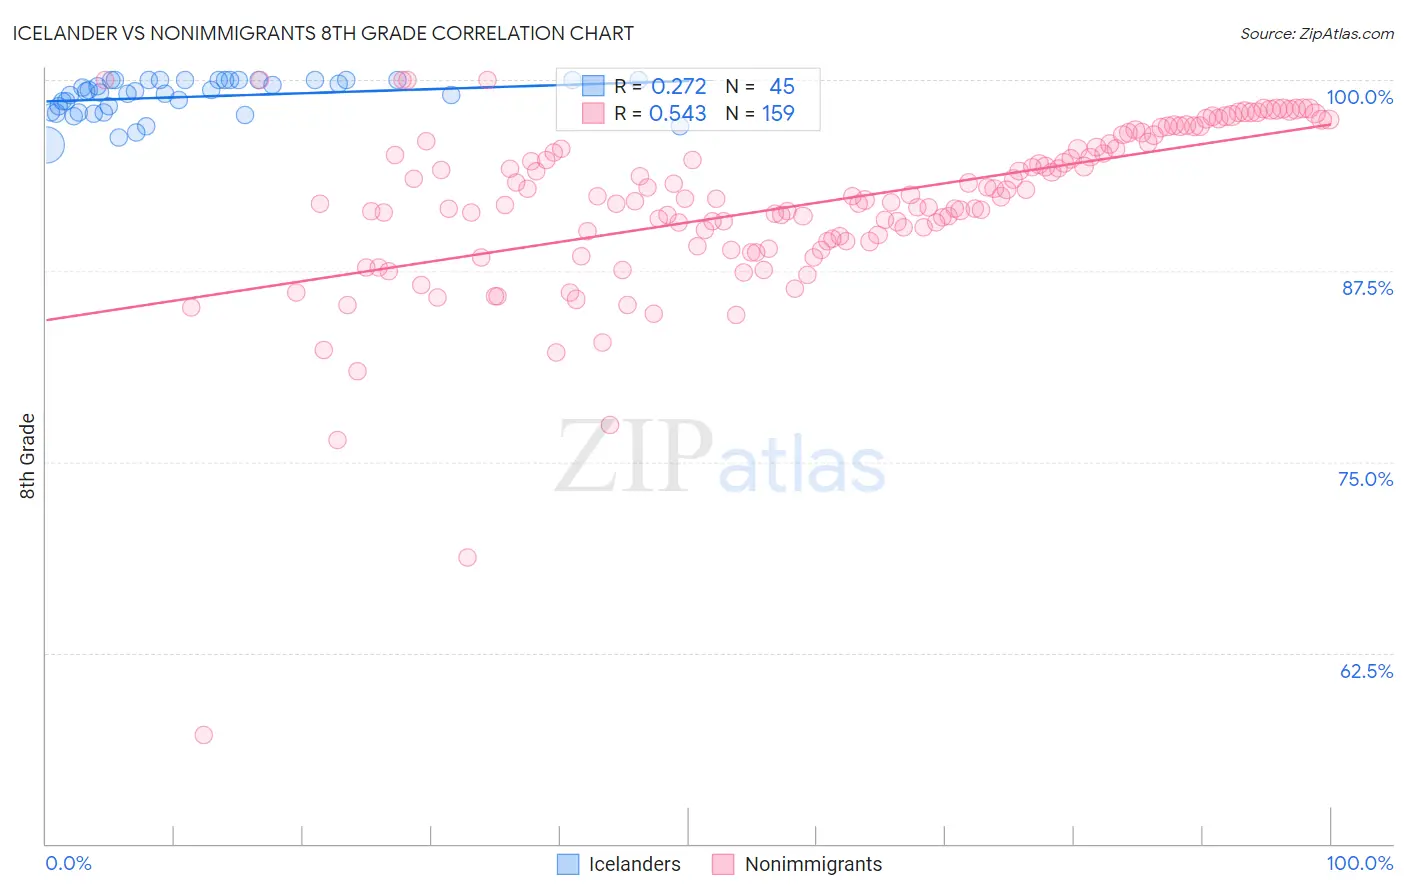
Icelander vs Nonimmigrants 8th Grade Correlation Chart
The statistical analysis conducted on geographies consisting of 159,668,915 people shows a weak positive correlation between the proportion of Icelanders and percentage of population with at least 8th grade education in the United States with a correlation coefficient (R) of 0.272 and weighted average of 96.5%. Similarly, the statistical analysis conducted on geographies consisting of 585,374,268 people shows a substantial positive correlation between the proportion of Nonimmigrants and percentage of population with at least 8th grade education in the United States with a correlation coefficient (R) of 0.543 and weighted average of 96.2%, a difference of 0.26%.
8th Grade Correlation Summary
| Measurement | Icelander | Nonimmigrants |
| Minimum | 95.8% | 57.2% |
| Maximum | 100.0% | 100.0% |
| Range | 4.2% | 42.8% |
| Mean | 98.9% | 91.9% |
| Median | 99.2% | 92.2% |
| Interquartile 25% (IQ1) | 97.9% | 89.5% |
| Interquartile 75% (IQ3) | 100.0% | 95.8% |
| Interquartile Range (IQR) | 2.1% | 6.3% |
| Standard Deviation (Sample) | 1.2% | 5.6% |
| Standard Deviation (Population) | 1.2% | 5.6% |
Similar Demographics by 8th Grade
Demographics Similar to Icelanders by 8th Grade
In terms of 8th grade, the demographic groups most similar to Icelanders are Delaware (96.5%, a difference of 0.010%), Romanian (96.5%, a difference of 0.010%), Turkish (96.5%, a difference of 0.010%), Immigrants from Belgium (96.5%, a difference of 0.010%), and Immigrants from South Africa (96.5%, a difference of 0.020%).
| Demographics | Rating | Rank | 8th Grade |
| Immigrants | Netherlands | 99.4 /100 | #76 | Exceptional 96.5% |
| Cypriots | 99.4 /100 | #77 | Exceptional 96.5% |
| Yugoslavians | 99.4 /100 | #78 | Exceptional 96.5% |
| Puget Sound Salish | 99.3 /100 | #79 | Exceptional 96.5% |
| Delaware | 99.2 /100 | #80 | Exceptional 96.5% |
| Romanians | 99.2 /100 | #81 | Exceptional 96.5% |
| Turks | 99.2 /100 | #82 | Exceptional 96.5% |
| Icelanders | 99.2 /100 | #83 | Exceptional 96.5% |
| Immigrants | Belgium | 99.1 /100 | #84 | Exceptional 96.5% |
| Immigrants | South Africa | 99.1 /100 | #85 | Exceptional 96.5% |
| Cherokee | 99.0 /100 | #86 | Exceptional 96.5% |
| Immigrants | Australia | 99.0 /100 | #87 | Exceptional 96.5% |
| Immigrants | Western Europe | 99.0 /100 | #88 | Exceptional 96.4% |
| Chickasaw | 98.9 /100 | #89 | Exceptional 96.4% |
| Immigrants | Sweden | 98.9 /100 | #90 | Exceptional 96.4% |
Demographics Similar to Nonimmigrants by 8th Grade
In terms of 8th grade, the demographic groups most similar to Nonimmigrants are Immigrants from Croatia (96.2%, a difference of 0.0%), Immigrants from Norway (96.2%, a difference of 0.010%), Immigrants from Japan (96.2%, a difference of 0.020%), Immigrants from Moldova (96.2%, a difference of 0.020%), and Shoshone (96.3%, a difference of 0.030%).
| Demographics | Rating | Rank | 8th Grade |
| Iroquois | 97.5 /100 | #109 | Exceptional 96.3% |
| Cajuns | 97.1 /100 | #110 | Exceptional 96.3% |
| Shoshone | 96.8 /100 | #111 | Exceptional 96.3% |
| Syrians | 96.7 /100 | #112 | Exceptional 96.3% |
| Immigrants | Zimbabwe | 96.7 /100 | #113 | Exceptional 96.3% |
| Immigrants | Japan | 96.5 /100 | #114 | Exceptional 96.2% |
| Immigrants | Moldova | 96.5 /100 | #115 | Exceptional 96.2% |
| Immigrants | Nonimmigrants | 96.0 /100 | #116 | Exceptional 96.2% |
| Immigrants | Croatia | 96.0 /100 | #117 | Exceptional 96.2% |
| Immigrants | Norway | 95.7 /100 | #118 | Exceptional 96.2% |
| Immigrants | Switzerland | 95.3 /100 | #119 | Exceptional 96.2% |
| Immigrants | France | 95.3 /100 | #120 | Exceptional 96.2% |
| Immigrants | Bulgaria | 95.3 /100 | #121 | Exceptional 96.2% |
| Immigrants | Europe | 95.3 /100 | #122 | Exceptional 96.2% |
| Filipinos | 94.6 /100 | #123 | Exceptional 96.2% |