German Russian vs Nonimmigrants 8th Grade
COMPARE
German Russian
Nonimmigrants
8th Grade
8th Grade Comparison
German Russians
Nonimmigrants
96.4%
8TH GRADE
98.8/ 100
METRIC RATING
95th/ 347
METRIC RANK
96.2%
8TH GRADE
96.0/ 100
METRIC RATING
116th/ 347
METRIC RANK
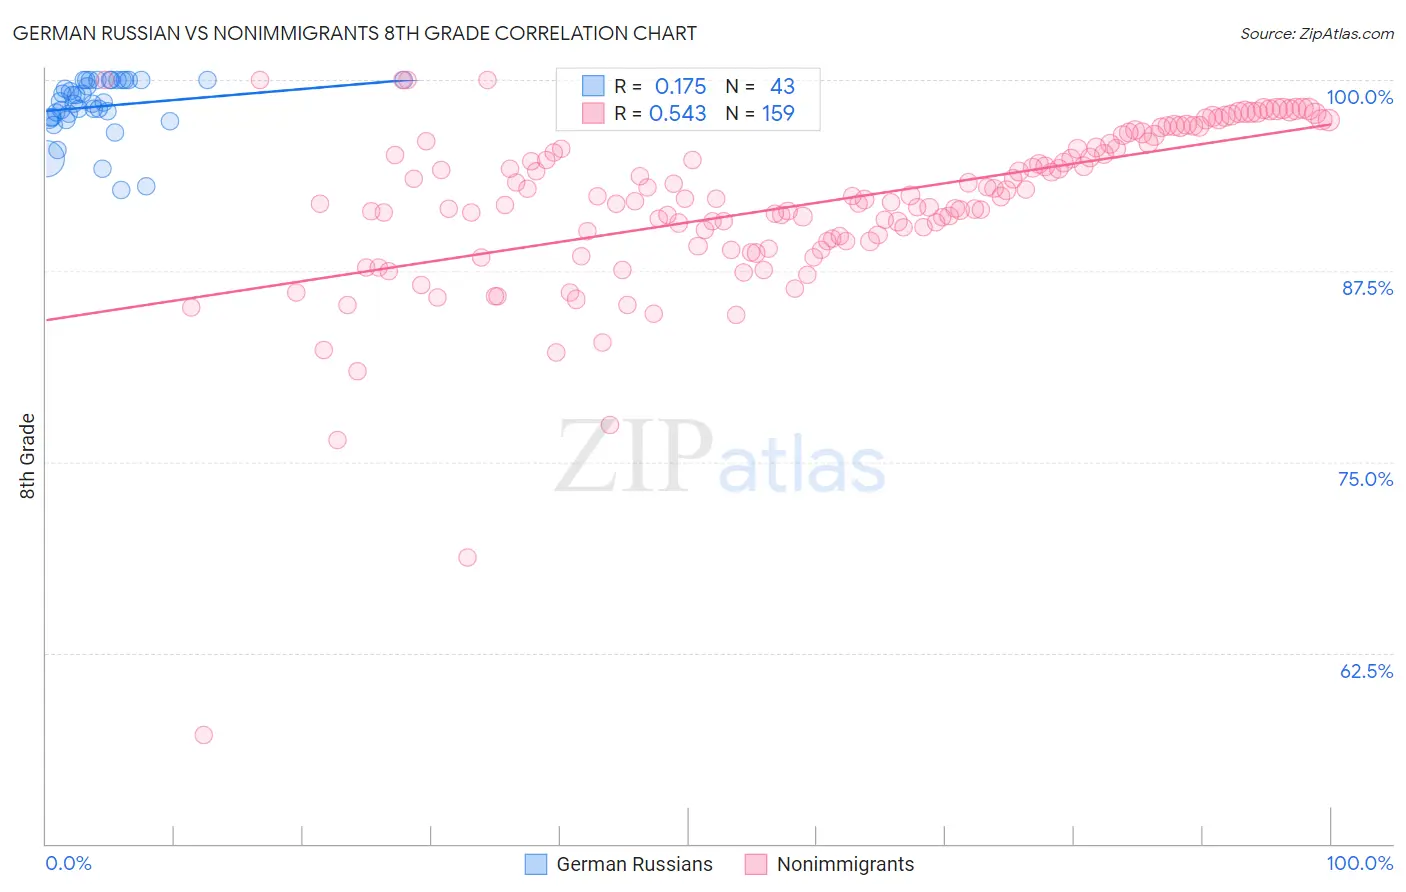
German Russian vs Nonimmigrants 8th Grade Correlation Chart
The statistical analysis conducted on geographies consisting of 96,461,984 people shows a poor positive correlation between the proportion of German Russians and percentage of population with at least 8th grade education in the United States with a correlation coefficient (R) of 0.175 and weighted average of 96.4%. Similarly, the statistical analysis conducted on geographies consisting of 585,374,268 people shows a substantial positive correlation between the proportion of Nonimmigrants and percentage of population with at least 8th grade education in the United States with a correlation coefficient (R) of 0.543 and weighted average of 96.2%, a difference of 0.19%.
8th Grade Correlation Summary
| Measurement | German Russian | Nonimmigrants |
| Minimum | 92.8% | 57.2% |
| Maximum | 100.0% | 100.0% |
| Range | 7.2% | 42.8% |
| Mean | 98.3% | 91.9% |
| Median | 98.5% | 92.2% |
| Interquartile 25% (IQ1) | 97.5% | 89.5% |
| Interquartile 75% (IQ3) | 100.0% | 95.8% |
| Interquartile Range (IQR) | 2.5% | 6.3% |
| Standard Deviation (Sample) | 1.9% | 5.6% |
| Standard Deviation (Population) | 1.9% | 5.6% |
Similar Demographics by 8th Grade
Demographics Similar to German Russians by 8th Grade
In terms of 8th grade, the demographic groups most similar to German Russians are Immigrants from Singapore (96.4%, a difference of 0.0%), Immigrants from Sweden (96.4%, a difference of 0.010%), Thai (96.4%, a difference of 0.010%), Menominee (96.4%, a difference of 0.010%), and Immigrants from Denmark (96.4%, a difference of 0.010%).
| Demographics | Rating | Rank | 8th Grade |
| Immigrants | Western Europe | 99.0 /100 | #88 | Exceptional 96.4% |
| Chickasaw | 98.9 /100 | #89 | Exceptional 96.4% |
| Immigrants | Sweden | 98.9 /100 | #90 | Exceptional 96.4% |
| Thais | 98.9 /100 | #91 | Exceptional 96.4% |
| Menominee | 98.9 /100 | #92 | Exceptional 96.4% |
| Immigrants | Denmark | 98.8 /100 | #93 | Exceptional 96.4% |
| Immigrants | Singapore | 98.8 /100 | #94 | Exceptional 96.4% |
| German Russians | 98.8 /100 | #95 | Exceptional 96.4% |
| Potawatomi | 98.7 /100 | #96 | Exceptional 96.4% |
| Osage | 98.7 /100 | #97 | Exceptional 96.4% |
| Immigrants | Germany | 98.7 /100 | #98 | Exceptional 96.4% |
| Cree | 98.6 /100 | #99 | Exceptional 96.4% |
| Immigrants | Czechoslovakia | 98.6 /100 | #100 | Exceptional 96.4% |
| Bhutanese | 98.2 /100 | #101 | Exceptional 96.4% |
| South Africans | 98.2 /100 | #102 | Exceptional 96.4% |
Demographics Similar to Nonimmigrants by 8th Grade
In terms of 8th grade, the demographic groups most similar to Nonimmigrants are Immigrants from Croatia (96.2%, a difference of 0.0%), Immigrants from Norway (96.2%, a difference of 0.010%), Immigrants from Japan (96.2%, a difference of 0.020%), Immigrants from Moldova (96.2%, a difference of 0.020%), and Shoshone (96.3%, a difference of 0.030%).
| Demographics | Rating | Rank | 8th Grade |
| Iroquois | 97.5 /100 | #109 | Exceptional 96.3% |
| Cajuns | 97.1 /100 | #110 | Exceptional 96.3% |
| Shoshone | 96.8 /100 | #111 | Exceptional 96.3% |
| Syrians | 96.7 /100 | #112 | Exceptional 96.3% |
| Immigrants | Zimbabwe | 96.7 /100 | #113 | Exceptional 96.3% |
| Immigrants | Japan | 96.5 /100 | #114 | Exceptional 96.2% |
| Immigrants | Moldova | 96.5 /100 | #115 | Exceptional 96.2% |
| Immigrants | Nonimmigrants | 96.0 /100 | #116 | Exceptional 96.2% |
| Immigrants | Croatia | 96.0 /100 | #117 | Exceptional 96.2% |
| Immigrants | Norway | 95.7 /100 | #118 | Exceptional 96.2% |
| Immigrants | Switzerland | 95.3 /100 | #119 | Exceptional 96.2% |
| Immigrants | France | 95.3 /100 | #120 | Exceptional 96.2% |
| Immigrants | Bulgaria | 95.3 /100 | #121 | Exceptional 96.2% |
| Immigrants | Europe | 95.3 /100 | #122 | Exceptional 96.2% |
| Filipinos | 94.6 /100 | #123 | Exceptional 96.2% |