Icelander vs Alaska Native 5th Grade

COMPARE

Icelander
Race
Ancestry
AfghanAfricanAlaskan AthabascanAlbanianAleutAlsatianAmericanApacheArabArapahoArgentineanArmenianAssyrian/Chaldean/SyriacAustralianAustrianBahamianBangladeshiBarbadianBasqueBelgianBelizeanBermudanBhutaneseBlackfeetBolivianBrazilianBritishBritish West IndianBulgarianBurmeseCajunCambodianCanadianCape VerdeanCarpatho RusynCelticCentral AmericanCentral American IndianCherokeeCheyenneChickasawChileanChineseChippewaChoctawColombianColvilleComancheCosta RicanCreeCreekCroatianCrowCubanCypriotCzechCzechoslovakianDanishDelawareDominicanDutchDutch West IndianEastern EuropeanEcuadorianEgyptianEnglishEstonianEthiopianEuropeanFijianFilipinoFinnishFrenchFrench American IndianFrench CanadianGermanGerman RussianGhanaianGreekGuamanian/ChamorroGuatemalanGuyaneseHaitianHmongHonduranHopiHoumaHungarianIcelanderIndian (Asian)IndonesianInupiatIranianIraqiIrishIroquoisIsraeliItalianJamaicanJapaneseJordanianKenyanKiowaKoreanLaotianLatvianLebaneseLiberianLithuanianLumbeeLuxembourgerMacedonianMalaysianMalteseMarshalleseMenomineeMexicanMexican American IndianMongolianMoroccanNative HawaiianNavajoNepaleseNew ZealanderNicaraguanNigerianNorthern EuropeanNorwegianOkinawanOsageOttawaPaiutePakistaniPalestinianPanamanianParaguayanPennsylvania GermanPeruvianPimaPolishPortuguesePotawatomiPuebloPuerto RicanPuget Sound SalishRomanianRussianSalvadoranSamoanScandinavianScotch-IrishScottishSeminoleSenegaleseSerbianShoshoneSierra LeoneanSiouxSlavicSlovakSloveneSomaliSouth AfricanSouth AmericanSouth American IndianSoviet UnionSpaniardSpanishSpanish AmericanSpanish American IndianSri LankanSubsaharan AfricanSudaneseSwedishSwissSyrianTaiwaneseThaiTlingit-HaidaTohono O'OdhamTonganTrinidadian and TobagonianTsimshianTurkishU.S. Virgin IslanderUgandanUkrainianUruguayanUteVenezuelanVietnameseWelshWest IndianYakamaYaquiYugoslavianYumanYup'ikZimbabwean
Immigration
NonimmigrantsImmigrantsAfghanistanAfricaAlbaniaArgentinaArmeniaAsiaAustraliaAustriaBahamasBangladeshBarbadosBelarusBelgiumBelizeBoliviaBosnia and HerzegovinaBrazilBulgariaBurma/MyanmarCabo VerdeCambodiaCameroonCanadaCaribbeanCentral AmericaChileChinaColombiaCongoCosta RicaCroatiaCubaCzechoslovakiaDenmarkDominicaDominican RepublicEastern AfricaEastern AsiaEastern EuropeEcuadorEgyptEl SalvadorEnglandEritreaEthiopiaEuropeFijiFranceGermanyGhanaGreeceGrenadaGuatemalaGuyanaHaitiHondurasHong KongHungaryIndiaIndonesiaIranIraqIrelandIsraelItalyJamaicaJapanJordanKazakhstanKenyaKoreaKuwaitLaosLatin AmericaLatviaLebanonLiberiaLithuaniaMalaysiaMexicoMicronesiaMiddle AfricaMoldovaMoroccoNepalNetherlandsNicaraguaNigeriaNorth AmericaNorth MacedoniaNorthern AfricaNorthern EuropeNorwayOceaniaPakistanPanamaPeruPhilippinesPolandPortugalRomaniaRussiaSaudi ArabiaScotlandSenegalSerbiaSierra LeoneSingaporeSomaliaSouth AfricaSouth AmericaSouth Central AsiaSouth Eastern AsiaSouthern EuropeSpainSri LankaSt. Vincent and the GrenadinesSudanSwedenSwitzerlandSyriaTaiwanThailandTrinidad and TobagoTurkeyUgandaUkraineUruguayUzbekistanVenezuelaVietnamWest IndiesWestern AfricaWestern AsiaWestern EuropeYemenZaireZimbabweAzores
Alaska Native
Race
Ancestry
AfghanAfricanAlaska NativeAlaskan AthabascanAlbanianAleutAlsatianAmericanApacheArabArapahoArgentineanArmenianAssyrian/Chaldean/SyriacAustralianAustrianBahamianBangladeshiBarbadianBasqueBelgianBelizeanBermudanBhutaneseBlackfeetBolivianBrazilianBritishBritish West IndianBulgarianBurmeseCajunCambodianCanadianCape VerdeanCarpatho RusynCelticCentral AmericanCentral American IndianCherokeeCheyenneChickasawChileanChineseChippewaChoctawColombianColvilleComancheCosta RicanCreeCreekCroatianCrowCubanCypriotCzechCzechoslovakianDanishDelawareDominicanDutchDutch West IndianEastern EuropeanEcuadorianEgyptianEnglishEstonianEthiopianEuropeanFijianFilipinoFinnishFrenchFrench American IndianFrench CanadianGermanGerman RussianGhanaianGreekGuamanian/ChamorroGuatemalanGuyaneseHaitianHmongHonduranHopiHoumaHungarianIndian (Asian)IndonesianInupiatIranianIraqiIrishIroquoisIsraeliItalianJamaicanJapaneseJordanianKenyanKiowaKoreanLaotianLatvianLebaneseLiberianLithuanianLumbeeLuxembourgerMacedonianMalaysianMalteseMarshalleseMenomineeMexicanMexican American IndianMongolianMoroccanNative HawaiianNavajoNepaleseNew ZealanderNicaraguanNigerianNorthern EuropeanNorwegianOkinawanOsageOttawaPaiutePakistaniPalestinianPanamanianParaguayanPennsylvania GermanPeruvianPimaPolishPortuguesePotawatomiPuebloPuerto RicanPuget Sound SalishRomanianRussianSalvadoranSamoanScandinavianScotch-IrishScottishSeminoleSenegaleseSerbianShoshoneSierra LeoneanSiouxSlavicSlovakSloveneSomaliSouth AfricanSouth AmericanSouth American IndianSoviet UnionSpaniardSpanishSpanish AmericanSpanish American IndianSri LankanSubsaharan AfricanSudaneseSwedishSwissSyrianTaiwaneseThaiTlingit-HaidaTohono O'OdhamTonganTrinidadian and TobagonianTsimshianTurkishU.S. Virgin IslanderUgandanUkrainianUruguayanUteVenezuelanVietnameseWelshWest IndianYakamaYaquiYugoslavianYumanYup'ikZimbabwean
Immigration
NonimmigrantsImmigrantsAfghanistanAfricaAlbaniaArgentinaArmeniaAsiaAustraliaAustriaBahamasBangladeshBarbadosBelarusBelgiumBelizeBoliviaBosnia and HerzegovinaBrazilBulgariaBurma/MyanmarCabo VerdeCambodiaCameroonCanadaCaribbeanCentral AmericaChileChinaColombiaCongoCosta RicaCroatiaCubaCzechoslovakiaDenmarkDominicaDominican RepublicEastern AfricaEastern AsiaEastern EuropeEcuadorEgyptEl SalvadorEnglandEritreaEthiopiaEuropeFijiFranceGermanyGhanaGreeceGrenadaGuatemalaGuyanaHaitiHondurasHong KongHungaryIndiaIndonesiaIranIraqIrelandIsraelItalyJamaicaJapanJordanKazakhstanKenyaKoreaKuwaitLaosLatin AmericaLatviaLebanonLiberiaLithuaniaMalaysiaMexicoMicronesiaMiddle AfricaMoldovaMoroccoNepalNetherlandsNicaraguaNigeriaNorth AmericaNorth MacedoniaNorthern AfricaNorthern EuropeNorwayOceaniaPakistanPanamaPeruPhilippinesPolandPortugalRomaniaRussiaSaudi ArabiaScotlandSenegalSerbiaSierra LeoneSingaporeSomaliaSouth AfricaSouth AmericaSouth Central AsiaSouth Eastern AsiaSouthern EuropeSpainSri LankaSt. Vincent and the GrenadinesSudanSwedenSwitzerlandSyriaTaiwanThailandTrinidad and TobagoTurkeyUgandaUkraineUruguayUzbekistanVenezuelaVietnamWest IndiesWestern AfricaWestern AsiaWestern EuropeYemenZaireZimbabweAzores
5th Grade
Income
Poverty
Unemployment
Labor Participation
Family Structure
Vehicle Availability
Education Level
Disability

5th Grade Comparison

Icelanders

Alaska Natives

Exceptional
Exceptional
97.8%
5TH GRADE
99.2/ 100
METRIC RATING
81st/ 347
METRIC RANK
98.2%
5TH GRADE
100.0/ 100
METRIC RATING
26th/ 347
METRIC RANK

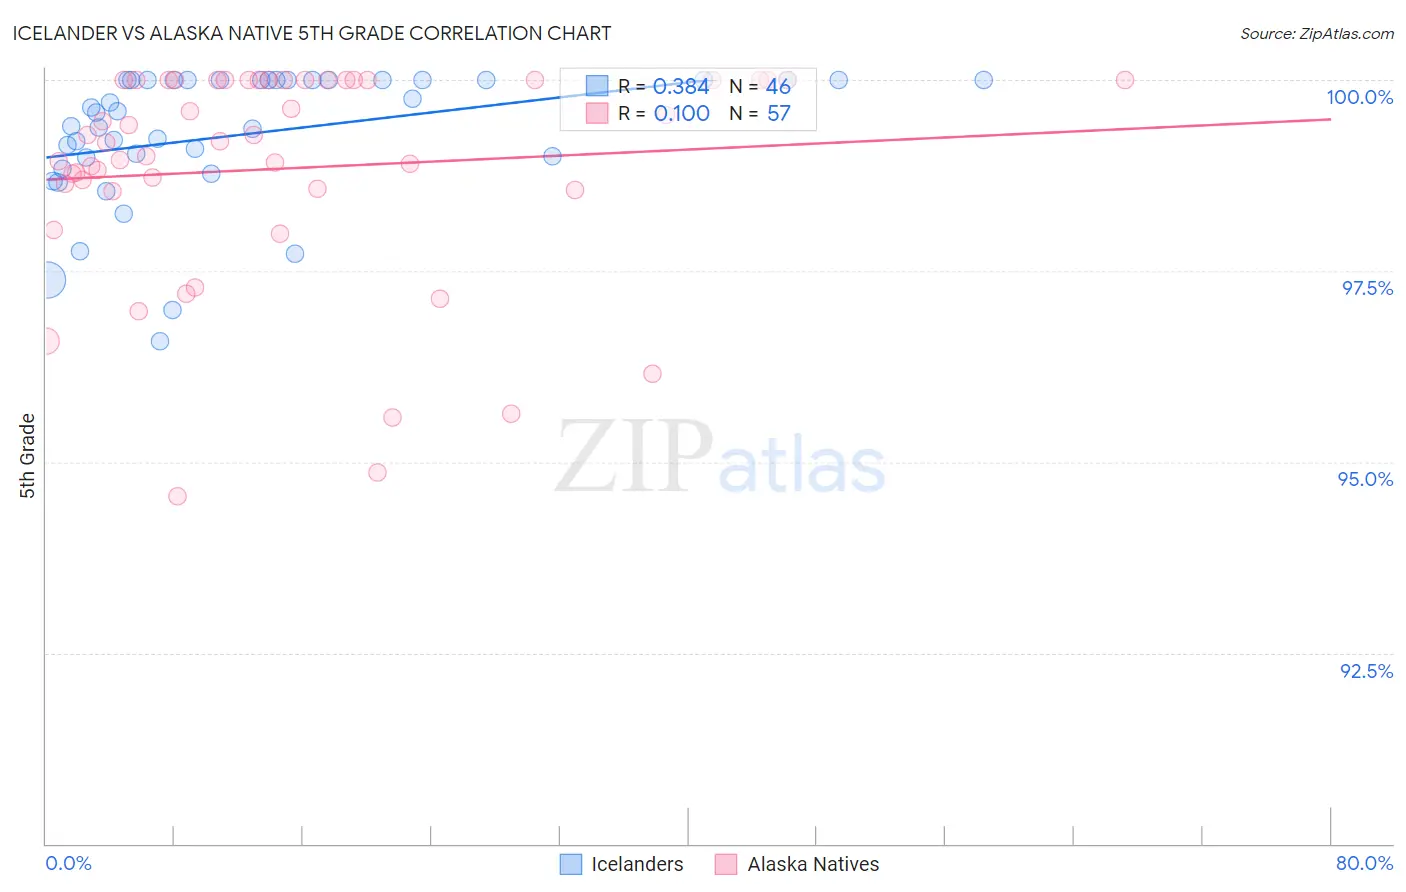
Icelander vs Alaska Native 5th Grade Correlation Chart

The statistical analysis conducted on geographies consisting of 159,668,975 people shows a mild positive correlation between the proportion of Icelanders and percentage of population with at least 5th grade education in the United States with a correlation coefficient (R) of 0.384 and weighted average of 97.8%. Similarly, the statistical analysis conducted on geographies consisting of 76,775,774 people shows a slight positive correlation between the proportion of Alaska Natives and percentage of population with at least 5th grade education in the United States with a correlation coefficient (R) of 0.100 and weighted average of 98.2%, a difference of 0.39%.
Icelander vs Alaska Native 5th Grade

5th Grade Correlation Summary

MeasurementIcelanderAlaska Native
Minimum96.6%94.6%
Maximum100.0%100.0%
Range3.4%5.4%
Mean99.3%98.8%
Median99.6%99.2%
Interquartile 25% (IQ1)99.0%98.6%
Interquartile 75% (IQ3)100.0%100.0%
Interquartile Range (IQR)1.0%1.4%
Standard Deviation (Sample)0.88%1.4%
Standard Deviation (Population)0.87%1.4%

Similar Demographics by 5th Grade

Demographics Similar to Icelanders by 5th Grade

In terms of 5th grade, the demographic groups most similar to Icelanders are Immigrants from Lithuania (97.8%, a difference of 0.0%), Immigrants from India (97.8%, a difference of 0.0%), Pueblo (97.8%, a difference of 0.0%), Immigrants from England (97.8%, a difference of 0.010%), and Osage (97.8%, a difference of 0.010%).
DemographicsRating | Rank5th Grade
Lumbee
99.3
/100
|
#74
Exceptional
97.8%
Ukrainians
99.3
/100
|
#75
Exceptional
97.8%
Immigrants | Netherlands
99.3
/100
|
#76
Exceptional
97.8%
Immigrants | England
99.3
/100
|
#77
Exceptional
97.8%
Osage
99.3
/100
|
#78
Exceptional
97.8%
Immigrants | Lithuania
99.2
/100
|
#79
Exceptional
97.8%
Immigrants | India
99.2
/100
|
#80
Exceptional
97.8%
Icelanders
99.2
/100
|
#81
Exceptional
97.8%
Pueblo
99.2
/100
|
#82
Exceptional
97.8%
Zimbabweans
99.0
/100
|
#83
Exceptional
97.8%
Potawatomi
99.0
/100
|
#84
Exceptional
97.8%
Immigrants | Belgium
99.0
/100
|
#85
Exceptional
97.8%
Cypriots
98.9
/100
|
#86
Exceptional
97.8%
Immigrants | Australia
98.8
/100
|
#87
Exceptional
97.8%
Shoshone
98.8
/100
|
#88
Exceptional
97.8%

Demographics Similar to Alaska Natives by 5th Grade

In terms of 5th grade, the demographic groups most similar to Alaska Natives are Yup'ik (98.2%, a difference of 0.0%), Croatian (98.2%, a difference of 0.010%), Sioux (98.2%, a difference of 0.010%), Scotch-Irish (98.2%, a difference of 0.010%), and French (98.2%, a difference of 0.010%).
DemographicsRating | Rank5th Grade
Finns
100.0
/100
|
#19
Exceptional
98.2%
Lithuanians
100.0
/100
|
#20
Exceptional
98.2%
Danes
100.0
/100
|
#21
Exceptional
98.2%
Croatians
100.0
/100
|
#22
Exceptional
98.2%
Sioux
100.0
/100
|
#23
Exceptional
98.2%
Scotch-Irish
100.0
/100
|
#24
Exceptional
98.2%
Yup'ik
100.0
/100
|
#25
Exceptional
98.2%
Alaska Natives
100.0
/100
|
#26
Exceptional
98.2%
French
100.0
/100
|
#27
Exceptional
98.2%
Czechs
100.0
/100
|
#28
Exceptional
98.2%
Scandinavians
100.0
/100
|
#29
Exceptional
98.2%
French Canadians
100.0
/100
|
#30
Exceptional
98.2%
Europeans
100.0
/100
|
#31
Exceptional
98.2%
Chippewa
100.0
/100
|
#32
Exceptional
98.1%
Swiss
100.0
/100
|
#33
Exceptional
98.1%