Hopi vs Immigrants from Zaire 2nd Grade
COMPARE
Hopi
Immigrants from Zaire
2nd Grade
2nd Grade Comparison
Hopi
Immigrants from Zaire
98.2%
2ND GRADE
99.1/ 100
METRIC RATING
84th/ 347
METRIC RANK
97.6%
2ND GRADE
4.3/ 100
METRIC RATING
224th/ 347
METRIC RANK
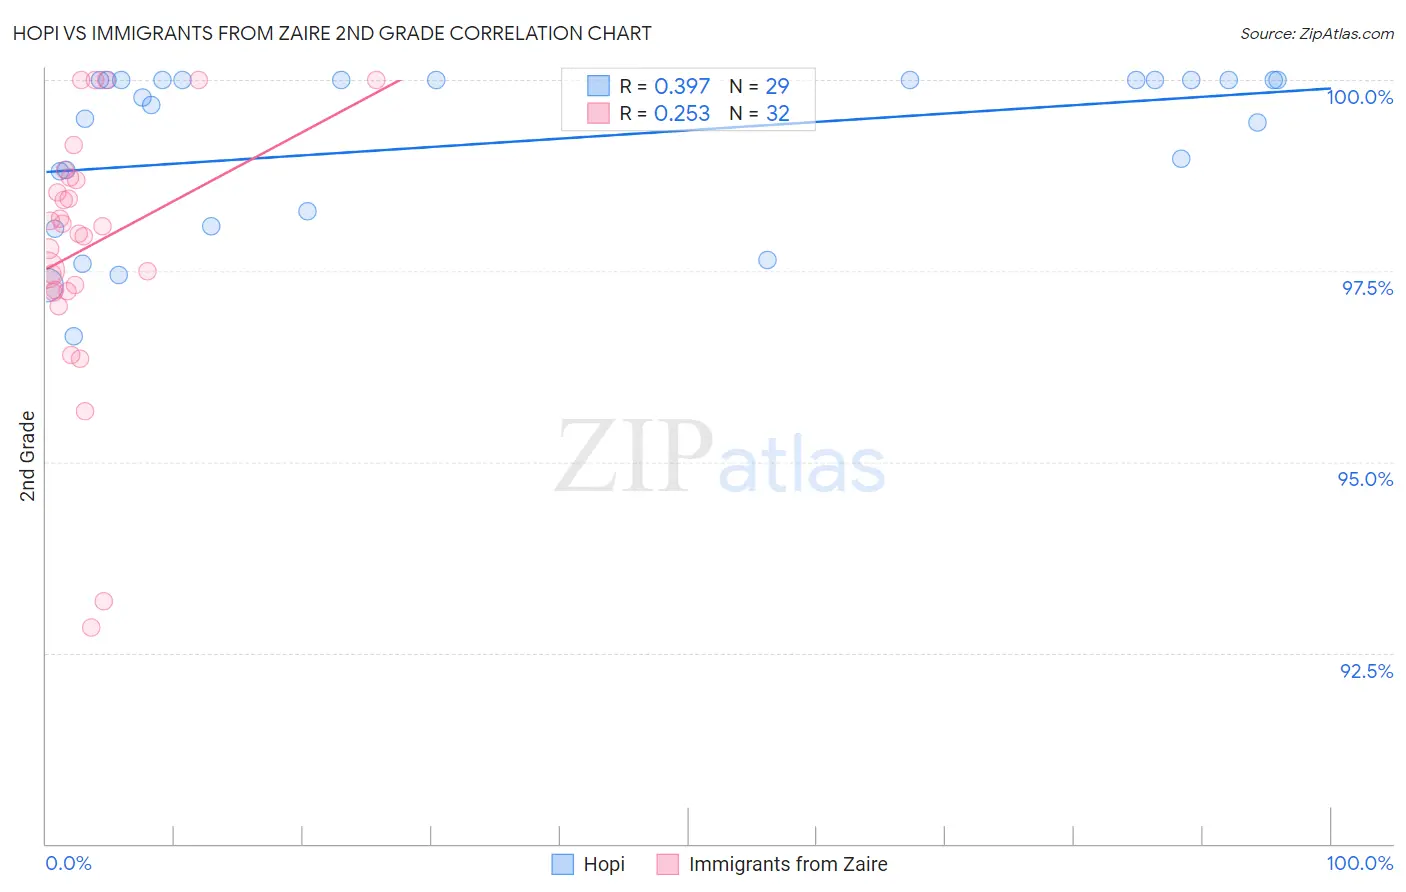
Hopi vs Immigrants from Zaire 2nd Grade Correlation Chart
The statistical analysis conducted on geographies consisting of 74,739,957 people shows a mild positive correlation between the proportion of Hopi and percentage of population with at least 2nd grade education in the United States with a correlation coefficient (R) of 0.397 and weighted average of 98.2%. Similarly, the statistical analysis conducted on geographies consisting of 107,255,805 people shows a weak positive correlation between the proportion of Immigrants from Zaire and percentage of population with at least 2nd grade education in the United States with a correlation coefficient (R) of 0.253 and weighted average of 97.6%, a difference of 0.62%.
2nd Grade Correlation Summary
| Measurement | Hopi | Immigrants from Zaire |
| Minimum | 96.6% | 92.8% |
| Maximum | 100.0% | 100.0% |
| Range | 3.4% | 7.2% |
| Mean | 99.2% | 97.8% |
| Median | 99.8% | 98.0% |
| Interquartile 25% (IQ1) | 98.2% | 97.2% |
| Interquartile 75% (IQ3) | 100.0% | 98.7% |
| Interquartile Range (IQR) | 1.8% | 1.5% |
| Standard Deviation (Sample) | 1.1% | 1.7% |
| Standard Deviation (Population) | 1.0% | 1.7% |
Similar Demographics by 2nd Grade
Demographics Similar to Hopi by 2nd Grade
In terms of 2nd grade, the demographic groups most similar to Hopi are Delaware (98.2%, a difference of 0.0%), Immigrants from Sweden (98.2%, a difference of 0.0%), Potawatomi (98.2%, a difference of 0.0%), Osage (98.2%, a difference of 0.010%), and Icelander (98.2%, a difference of 0.010%).
| Demographics | Rating | Rank | 2nd Grade |
| Immigrants | England | 99.4 /100 | #77 | Exceptional 98.3% |
| Immigrants | Lithuania | 99.3 /100 | #78 | Exceptional 98.2% |
| Immigrants | Belgium | 99.3 /100 | #79 | Exceptional 98.2% |
| Osage | 99.2 /100 | #80 | Exceptional 98.2% |
| Icelanders | 99.2 /100 | #81 | Exceptional 98.2% |
| Delaware | 99.1 /100 | #82 | Exceptional 98.2% |
| Immigrants | Sweden | 99.1 /100 | #83 | Exceptional 98.2% |
| Hopi | 99.1 /100 | #84 | Exceptional 98.2% |
| Potawatomi | 99.1 /100 | #85 | Exceptional 98.2% |
| Immigrants | Australia | 99.0 /100 | #86 | Exceptional 98.2% |
| Immigrants | Denmark | 99.0 /100 | #87 | Exceptional 98.2% |
| Macedonians | 99.0 /100 | #88 | Exceptional 98.2% |
| Ukrainians | 98.9 /100 | #89 | Exceptional 98.2% |
| Zimbabweans | 98.8 /100 | #90 | Exceptional 98.2% |
| Immigrants | Western Europe | 98.8 /100 | #91 | Exceptional 98.2% |
Demographics Similar to Immigrants from Zaire by 2nd Grade
In terms of 2nd grade, the demographic groups most similar to Immigrants from Zaire are Immigrants from Sudan (97.6%, a difference of 0.0%), Sierra Leonean (97.6%, a difference of 0.0%), Tongan (97.6%, a difference of 0.0%), Immigrants from Morocco (97.6%, a difference of 0.010%), and Iraqi (97.6%, a difference of 0.010%).
| Demographics | Rating | Rank | 2nd Grade |
| Uruguayans | 6.2 /100 | #217 | Tragic 97.7% |
| Sudanese | 5.7 /100 | #218 | Tragic 97.7% |
| Immigrants | Panama | 5.1 /100 | #219 | Tragic 97.6% |
| Immigrants | Morocco | 5.0 /100 | #220 | Tragic 97.6% |
| Iraqis | 4.6 /100 | #221 | Tragic 97.6% |
| Immigrants | Sudan | 4.5 /100 | #222 | Tragic 97.6% |
| Sierra Leoneans | 4.3 /100 | #223 | Tragic 97.6% |
| Immigrants | Zaire | 4.3 /100 | #224 | Tragic 97.6% |
| Tongans | 4.3 /100 | #225 | Tragic 97.6% |
| Immigrants | Syria | 4.0 /100 | #226 | Tragic 97.6% |
| Immigrants | Nepal | 4.0 /100 | #227 | Tragic 97.6% |
| Sub-Saharan Africans | 3.4 /100 | #228 | Tragic 97.6% |
| Immigrants | Costa Rica | 3.1 /100 | #229 | Tragic 97.6% |
| Senegalese | 3.1 /100 | #230 | Tragic 97.6% |
| Immigrants | Pakistan | 2.3 /100 | #231 | Tragic 97.6% |