Hopi vs Immigrants from Barbados 2nd Grade
COMPARE
Hopi
Immigrants from Barbados
2nd Grade
2nd Grade Comparison
Hopi
Immigrants from Barbados
98.2%
2ND GRADE
99.1/ 100
METRIC RATING
84th/ 347
METRIC RANK
97.2%
2ND GRADE
0.0/ 100
METRIC RATING
286th/ 347
METRIC RANK
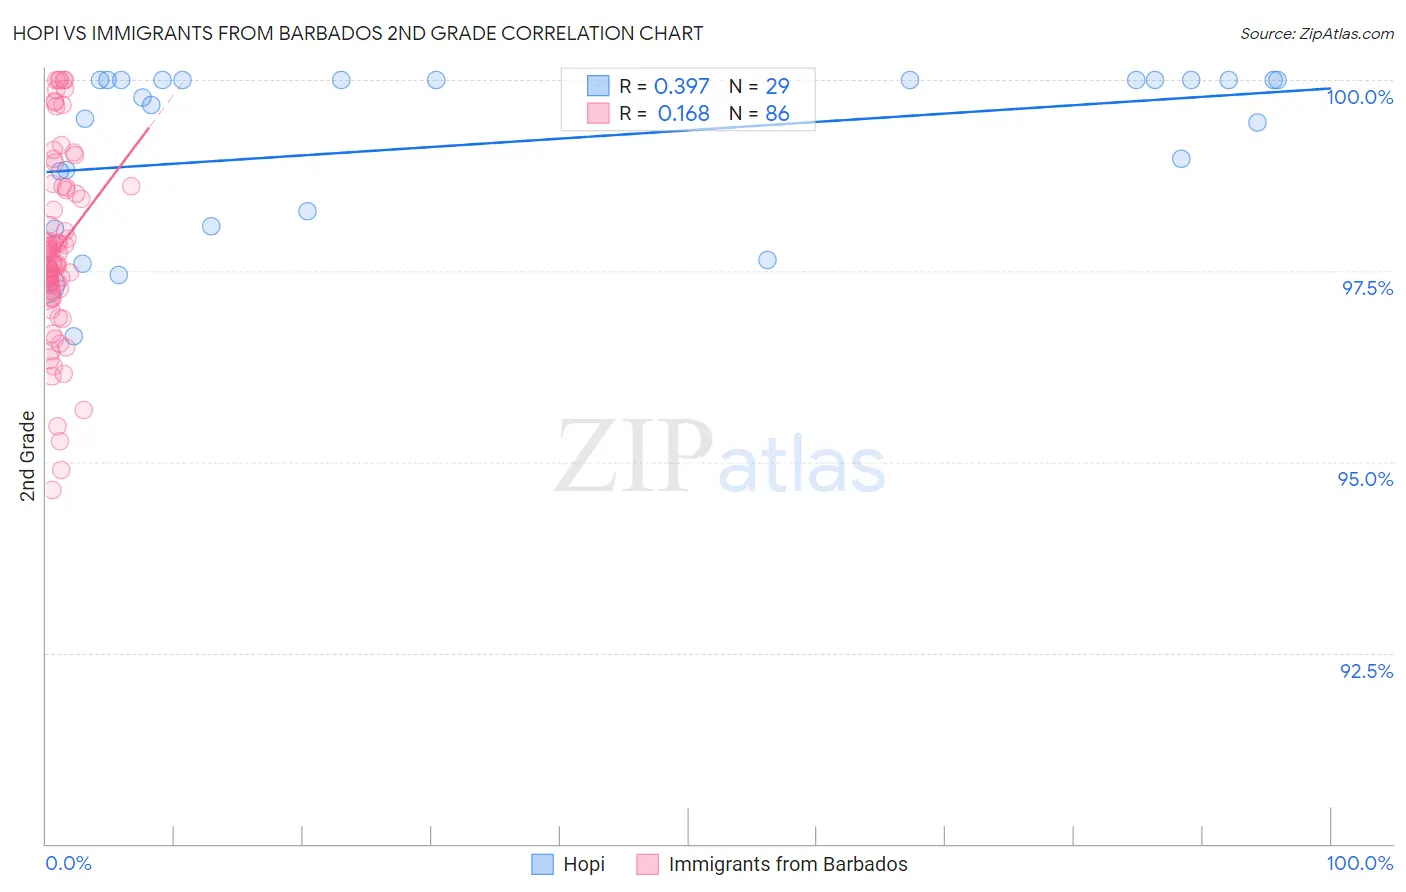
Hopi vs Immigrants from Barbados 2nd Grade Correlation Chart
The statistical analysis conducted on geographies consisting of 74,739,957 people shows a mild positive correlation between the proportion of Hopi and percentage of population with at least 2nd grade education in the United States with a correlation coefficient (R) of 0.397 and weighted average of 98.2%. Similarly, the statistical analysis conducted on geographies consisting of 112,787,503 people shows a poor positive correlation between the proportion of Immigrants from Barbados and percentage of population with at least 2nd grade education in the United States with a correlation coefficient (R) of 0.168 and weighted average of 97.2%, a difference of 1.0%.
2nd Grade Correlation Summary
| Measurement | Hopi | Immigrants from Barbados |
| Minimum | 96.6% | 94.6% |
| Maximum | 100.0% | 100.0% |
| Range | 3.4% | 5.4% |
| Mean | 99.2% | 97.8% |
| Median | 99.8% | 97.6% |
| Interquartile 25% (IQ1) | 98.2% | 97.2% |
| Interquartile 75% (IQ3) | 100.0% | 98.6% |
| Interquartile Range (IQR) | 1.8% | 1.3% |
| Standard Deviation (Sample) | 1.1% | 1.2% |
| Standard Deviation (Population) | 1.0% | 1.2% |
Similar Demographics by 2nd Grade
Demographics Similar to Hopi by 2nd Grade
In terms of 2nd grade, the demographic groups most similar to Hopi are Delaware (98.2%, a difference of 0.0%), Immigrants from Sweden (98.2%, a difference of 0.0%), Potawatomi (98.2%, a difference of 0.0%), Osage (98.2%, a difference of 0.010%), and Icelander (98.2%, a difference of 0.010%).
| Demographics | Rating | Rank | 2nd Grade |
| Immigrants | England | 99.4 /100 | #77 | Exceptional 98.3% |
| Immigrants | Lithuania | 99.3 /100 | #78 | Exceptional 98.2% |
| Immigrants | Belgium | 99.3 /100 | #79 | Exceptional 98.2% |
| Osage | 99.2 /100 | #80 | Exceptional 98.2% |
| Icelanders | 99.2 /100 | #81 | Exceptional 98.2% |
| Delaware | 99.1 /100 | #82 | Exceptional 98.2% |
| Immigrants | Sweden | 99.1 /100 | #83 | Exceptional 98.2% |
| Hopi | 99.1 /100 | #84 | Exceptional 98.2% |
| Potawatomi | 99.1 /100 | #85 | Exceptional 98.2% |
| Immigrants | Australia | 99.0 /100 | #86 | Exceptional 98.2% |
| Immigrants | Denmark | 99.0 /100 | #87 | Exceptional 98.2% |
| Macedonians | 99.0 /100 | #88 | Exceptional 98.2% |
| Ukrainians | 98.9 /100 | #89 | Exceptional 98.2% |
| Zimbabweans | 98.8 /100 | #90 | Exceptional 98.2% |
| Immigrants | Western Europe | 98.8 /100 | #91 | Exceptional 98.2% |
Demographics Similar to Immigrants from Barbados by 2nd Grade
In terms of 2nd grade, the demographic groups most similar to Immigrants from Barbados are Immigrants from Hong Kong (97.2%, a difference of 0.0%), Immigrants from Portugal (97.2%, a difference of 0.0%), Immigrants from Thailand (97.2%, a difference of 0.010%), Immigrants from Trinidad and Tobago (97.2%, a difference of 0.020%), and Immigrants from West Indies (97.2%, a difference of 0.020%).
| Demographics | Rating | Rank | 2nd Grade |
| Immigrants | Ghana | 0.1 /100 | #279 | Tragic 97.3% |
| Afghans | 0.1 /100 | #280 | Tragic 97.3% |
| Trinidadians and Tobagonians | 0.1 /100 | #281 | Tragic 97.3% |
| Barbadians | 0.1 /100 | #282 | Tragic 97.3% |
| Immigrants | Trinidad and Tobago | 0.0 /100 | #283 | Tragic 97.2% |
| Immigrants | West Indies | 0.0 /100 | #284 | Tragic 97.2% |
| Immigrants | Hong Kong | 0.0 /100 | #285 | Tragic 97.2% |
| Immigrants | Barbados | 0.0 /100 | #286 | Tragic 97.2% |
| Immigrants | Portugal | 0.0 /100 | #287 | Tragic 97.2% |
| Immigrants | Thailand | 0.0 /100 | #288 | Tragic 97.2% |
| Houma | 0.0 /100 | #289 | Tragic 97.2% |
| Immigrants | St. Vincent and the Grenadines | 0.0 /100 | #290 | Tragic 97.2% |
| Immigrants | Afghanistan | 0.0 /100 | #291 | Tragic 97.2% |
| Immigrants | Eritrea | 0.0 /100 | #292 | Tragic 97.2% |
| British West Indians | 0.0 /100 | #293 | Tragic 97.2% |