Guyanese vs Yuman 6th Grade
COMPARE
Guyanese
Yuman
6th Grade
6th Grade Comparison
Guyanese
Yuman
95.6%
6TH GRADE
0.0/ 100
METRIC RATING
307th/ 347
METRIC RANK
96.7%
6TH GRADE
3.2/ 100
METRIC RATING
233rd/ 347
METRIC RANK
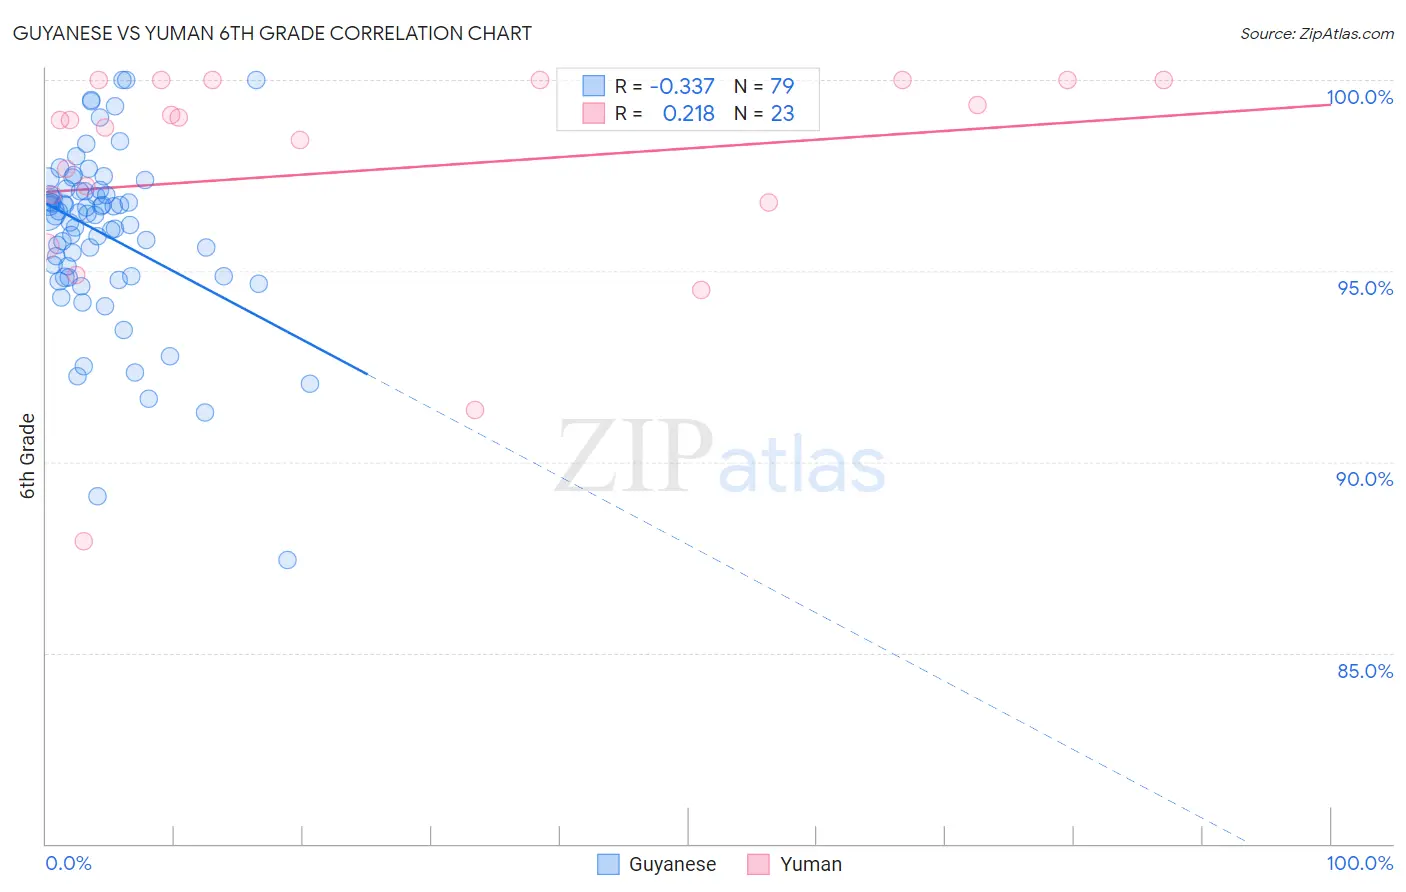
Guyanese vs Yuman 6th Grade Correlation Chart
The statistical analysis conducted on geographies consisting of 176,921,765 people shows a mild negative correlation between the proportion of Guyanese and percentage of population with at least 6th grade education in the United States with a correlation coefficient (R) of -0.337 and weighted average of 95.6%. Similarly, the statistical analysis conducted on geographies consisting of 40,696,349 people shows a weak positive correlation between the proportion of Yuman and percentage of population with at least 6th grade education in the United States with a correlation coefficient (R) of 0.218 and weighted average of 96.7%, a difference of 1.2%.
6th Grade Correlation Summary
| Measurement | Guyanese | Yuman |
| Minimum | 87.4% | 87.9% |
| Maximum | 100.0% | 100.0% |
| Range | 12.6% | 12.1% |
| Mean | 96.0% | 97.6% |
| Median | 96.5% | 98.9% |
| Interquartile 25% (IQ1) | 94.9% | 96.8% |
| Interquartile 75% (IQ3) | 97.1% | 100.0% |
| Interquartile Range (IQR) | 2.2% | 3.2% |
| Standard Deviation (Sample) | 2.3% | 3.1% |
| Standard Deviation (Population) | 2.2% | 3.0% |
Similar Demographics by 6th Grade
Demographics Similar to Guyanese by 6th Grade
In terms of 6th grade, the demographic groups most similar to Guyanese are Immigrants from Caribbean (95.6%, a difference of 0.010%), Immigrants from Haiti (95.6%, a difference of 0.020%), Immigrants from Cuba (95.6%, a difference of 0.060%), Puerto Rican (95.5%, a difference of 0.060%), and Ecuadorian (95.5%, a difference of 0.070%).
| Demographics | Rating | Rank | 6th Grade |
| Immigrants | Dominica | 0.0 /100 | #300 | Tragic 95.7% |
| Immigrants | Immigrants | 0.0 /100 | #301 | Tragic 95.7% |
| Immigrants | Burma/Myanmar | 0.0 /100 | #302 | Tragic 95.7% |
| Bangladeshis | 0.0 /100 | #303 | Tragic 95.7% |
| Indonesians | 0.0 /100 | #304 | Tragic 95.6% |
| Immigrants | Cuba | 0.0 /100 | #305 | Tragic 95.6% |
| Immigrants | Haiti | 0.0 /100 | #306 | Tragic 95.6% |
| Guyanese | 0.0 /100 | #307 | Tragic 95.6% |
| Immigrants | Caribbean | 0.0 /100 | #308 | Tragic 95.6% |
| Puerto Ricans | 0.0 /100 | #309 | Tragic 95.5% |
| Ecuadorians | 0.0 /100 | #310 | Tragic 95.5% |
| Immigrants | Portugal | 0.0 /100 | #311 | Tragic 95.5% |
| Immigrants | Guyana | 0.0 /100 | #312 | Tragic 95.5% |
| Nicaraguans | 0.0 /100 | #313 | Tragic 95.4% |
| Immigrants | Vietnam | 0.0 /100 | #314 | Tragic 95.4% |
Demographics Similar to Yuman by 6th Grade
In terms of 6th grade, the demographic groups most similar to Yuman are Subsaharan African (96.7%, a difference of 0.010%), South American Indian (96.7%, a difference of 0.010%), Immigrants from Panama (96.7%, a difference of 0.030%), Immigrants from Western Asia (96.7%, a difference of 0.030%), and Immigrants from Malaysia (96.7%, a difference of 0.030%).
| Demographics | Rating | Rank | 6th Grade |
| Immigrants | Panama | 4.2 /100 | #226 | Tragic 96.7% |
| Immigrants | Western Asia | 4.1 /100 | #227 | Tragic 96.7% |
| Immigrants | Malaysia | 4.0 /100 | #228 | Tragic 96.7% |
| Assyrians/Chaldeans/Syriacs | 4.0 /100 | #229 | Tragic 96.7% |
| Immigrants | Eastern Asia | 4.0 /100 | #230 | Tragic 96.7% |
| Sub-Saharan Africans | 3.5 /100 | #231 | Tragic 96.7% |
| South American Indians | 3.5 /100 | #232 | Tragic 96.7% |
| Yuman | 3.2 /100 | #233 | Tragic 96.7% |
| Uruguayans | 2.5 /100 | #234 | Tragic 96.6% |
| Asians | 2.4 /100 | #235 | Tragic 96.6% |
| Immigrants | Indonesia | 2.3 /100 | #236 | Tragic 96.6% |
| Immigrants | Eastern Africa | 2.0 /100 | #237 | Tragic 96.6% |
| Nigerians | 1.9 /100 | #238 | Tragic 96.6% |
| Indians (Asian) | 1.9 /100 | #239 | Tragic 96.6% |
| Koreans | 1.9 /100 | #240 | Tragic 96.6% |