Guyanese vs Cajun 6th Grade
COMPARE
Guyanese
Cajun
6th Grade
6th Grade Comparison
Guyanese
Cajuns
95.6%
6TH GRADE
0.0/ 100
METRIC RATING
307th/ 347
METRIC RANK
97.6%
6TH GRADE
99.5/ 100
METRIC RATING
70th/ 347
METRIC RANK
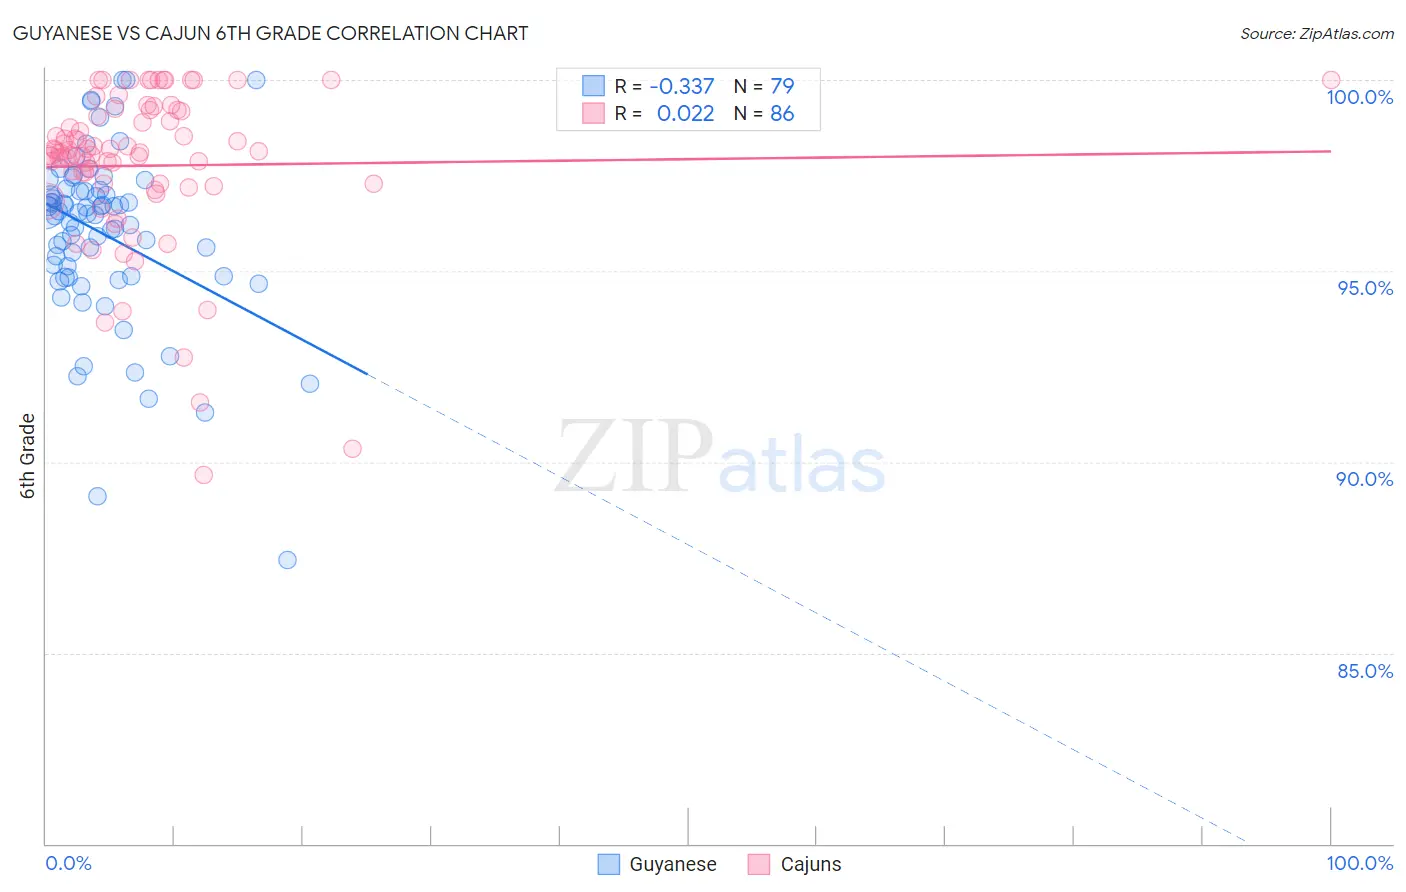
Guyanese vs Cajun 6th Grade Correlation Chart
The statistical analysis conducted on geographies consisting of 176,921,765 people shows a mild negative correlation between the proportion of Guyanese and percentage of population with at least 6th grade education in the United States with a correlation coefficient (R) of -0.337 and weighted average of 95.6%. Similarly, the statistical analysis conducted on geographies consisting of 149,712,957 people shows no correlation between the proportion of Cajuns and percentage of population with at least 6th grade education in the United States with a correlation coefficient (R) of 0.022 and weighted average of 97.6%, a difference of 2.2%.
6th Grade Correlation Summary
| Measurement | Guyanese | Cajun |
| Minimum | 87.4% | 89.7% |
| Maximum | 100.0% | 100.0% |
| Range | 12.6% | 10.3% |
| Mean | 96.0% | 97.8% |
| Median | 96.5% | 98.1% |
| Interquartile 25% (IQ1) | 94.9% | 97.3% |
| Interquartile 75% (IQ3) | 97.1% | 99.2% |
| Interquartile Range (IQR) | 2.2% | 1.9% |
| Standard Deviation (Sample) | 2.3% | 2.1% |
| Standard Deviation (Population) | 2.2% | 2.1% |
Similar Demographics by 6th Grade
Demographics Similar to Guyanese by 6th Grade
In terms of 6th grade, the demographic groups most similar to Guyanese are Immigrants from Caribbean (95.6%, a difference of 0.010%), Immigrants from Haiti (95.6%, a difference of 0.020%), Immigrants from Cuba (95.6%, a difference of 0.060%), Puerto Rican (95.5%, a difference of 0.060%), and Ecuadorian (95.5%, a difference of 0.070%).
| Demographics | Rating | Rank | 6th Grade |
| Immigrants | Dominica | 0.0 /100 | #300 | Tragic 95.7% |
| Immigrants | Immigrants | 0.0 /100 | #301 | Tragic 95.7% |
| Immigrants | Burma/Myanmar | 0.0 /100 | #302 | Tragic 95.7% |
| Bangladeshis | 0.0 /100 | #303 | Tragic 95.7% |
| Indonesians | 0.0 /100 | #304 | Tragic 95.6% |
| Immigrants | Cuba | 0.0 /100 | #305 | Tragic 95.6% |
| Immigrants | Haiti | 0.0 /100 | #306 | Tragic 95.6% |
| Guyanese | 0.0 /100 | #307 | Tragic 95.6% |
| Immigrants | Caribbean | 0.0 /100 | #308 | Tragic 95.6% |
| Puerto Ricans | 0.0 /100 | #309 | Tragic 95.5% |
| Ecuadorians | 0.0 /100 | #310 | Tragic 95.5% |
| Immigrants | Portugal | 0.0 /100 | #311 | Tragic 95.5% |
| Immigrants | Guyana | 0.0 /100 | #312 | Tragic 95.5% |
| Nicaraguans | 0.0 /100 | #313 | Tragic 95.4% |
| Immigrants | Vietnam | 0.0 /100 | #314 | Tragic 95.4% |
Demographics Similar to Cajuns by 6th Grade
In terms of 6th grade, the demographic groups most similar to Cajuns are Iranian (97.6%, a difference of 0.010%), Chickasaw (97.6%, a difference of 0.010%), Macedonian (97.6%, a difference of 0.020%), Cherokee (97.6%, a difference of 0.020%), and New Zealander (97.7%, a difference of 0.030%).
| Demographics | Rating | Rank | 6th Grade |
| Russians | 99.7 /100 | #63 | Exceptional 97.7% |
| Canadians | 99.7 /100 | #64 | Exceptional 97.7% |
| Immigrants | Northern Europe | 99.6 /100 | #65 | Exceptional 97.7% |
| New Zealanders | 99.6 /100 | #66 | Exceptional 97.7% |
| Kiowa | 99.6 /100 | #67 | Exceptional 97.7% |
| Immigrants | Austria | 99.6 /100 | #68 | Exceptional 97.7% |
| Iranians | 99.6 /100 | #69 | Exceptional 97.6% |
| Cajuns | 99.5 /100 | #70 | Exceptional 97.6% |
| Chickasaw | 99.5 /100 | #71 | Exceptional 97.6% |
| Macedonians | 99.4 /100 | #72 | Exceptional 97.6% |
| Cherokee | 99.4 /100 | #73 | Exceptional 97.6% |
| Immigrants | Netherlands | 99.4 /100 | #74 | Exceptional 97.6% |
| Ukrainians | 99.4 /100 | #75 | Exceptional 97.6% |
| Immigrants | England | 99.4 /100 | #76 | Exceptional 97.6% |
| Immigrants | Lithuania | 99.3 /100 | #77 | Exceptional 97.6% |