Ecuadorian vs Immigrants from Bosnia and Herzegovina 5th Grade
COMPARE
Ecuadorian
Immigrants from Bosnia and Herzegovina
5th Grade
5th Grade Comparison
Ecuadorians
Immigrants from Bosnia and Herzegovina
96.0%
5TH GRADE
0.0/ 100
METRIC RATING
308th/ 347
METRIC RANK
97.4%
5TH GRADE
71.0/ 100
METRIC RATING
155th/ 347
METRIC RANK
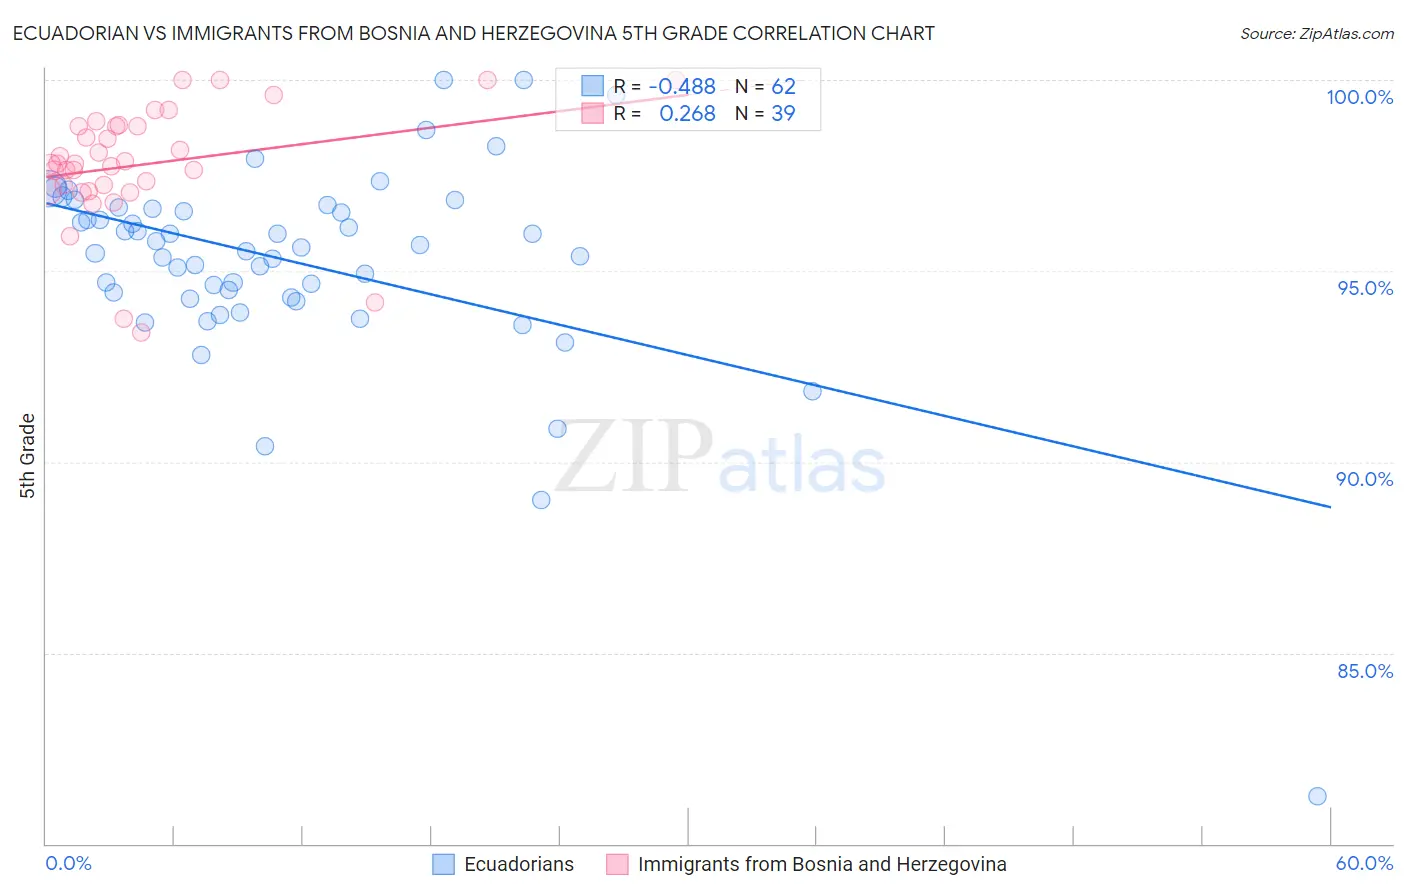
Ecuadorian vs Immigrants from Bosnia and Herzegovina 5th Grade Correlation Chart
The statistical analysis conducted on geographies consisting of 317,865,755 people shows a moderate negative correlation between the proportion of Ecuadorians and percentage of population with at least 5th grade education in the United States with a correlation coefficient (R) of -0.488 and weighted average of 96.0%. Similarly, the statistical analysis conducted on geographies consisting of 156,779,463 people shows a weak positive correlation between the proportion of Immigrants from Bosnia and Herzegovina and percentage of population with at least 5th grade education in the United States with a correlation coefficient (R) of 0.268 and weighted average of 97.4%, a difference of 1.5%.
5th Grade Correlation Summary
| Measurement | Ecuadorian | Immigrants from Bosnia and Herzegovina |
| Minimum | 81.2% | 93.4% |
| Maximum | 100.0% | 100.0% |
| Range | 18.7% | 6.6% |
| Mean | 95.2% | 97.8% |
| Median | 95.6% | 97.8% |
| Interquartile 25% (IQ1) | 94.3% | 97.1% |
| Interquartile 75% (IQ3) | 96.6% | 98.8% |
| Interquartile Range (IQR) | 2.3% | 1.7% |
| Standard Deviation (Sample) | 2.7% | 1.5% |
| Standard Deviation (Population) | 2.7% | 1.5% |
Similar Demographics by 5th Grade
Demographics Similar to Ecuadorians by 5th Grade
In terms of 5th grade, the demographic groups most similar to Ecuadorians are Immigrants from Haiti (96.0%, a difference of 0.010%), Immigrants from Caribbean (96.0%, a difference of 0.010%), Immigrants from Guyana (96.0%, a difference of 0.010%), Immigrants from Laos (96.0%, a difference of 0.030%), and Immigrants from Burma/Myanmar (96.1%, a difference of 0.040%).
| Demographics | Rating | Rank | 5th Grade |
| Immigrants | Cuba | 0.0 /100 | #301 | Tragic 96.1% |
| Guyanese | 0.0 /100 | #302 | Tragic 96.1% |
| Puerto Ricans | 0.0 /100 | #303 | Tragic 96.1% |
| Immigrants | Burma/Myanmar | 0.0 /100 | #304 | Tragic 96.1% |
| Immigrants | Laos | 0.0 /100 | #305 | Tragic 96.0% |
| Immigrants | Haiti | 0.0 /100 | #306 | Tragic 96.0% |
| Immigrants | Caribbean | 0.0 /100 | #307 | Tragic 96.0% |
| Ecuadorians | 0.0 /100 | #308 | Tragic 96.0% |
| Immigrants | Guyana | 0.0 /100 | #309 | Tragic 96.0% |
| Indonesians | 0.0 /100 | #310 | Tragic 96.0% |
| Immigrants | Bangladesh | 0.0 /100 | #311 | Tragic 96.0% |
| Vietnamese | 0.0 /100 | #312 | Tragic 95.9% |
| Bangladeshis | 0.0 /100 | #313 | Tragic 95.9% |
| Immigrants | Portugal | 0.0 /100 | #314 | Tragic 95.9% |
| Nicaraguans | 0.0 /100 | #315 | Tragic 95.9% |
Demographics Similar to Immigrants from Bosnia and Herzegovina by 5th Grade
In terms of 5th grade, the demographic groups most similar to Immigrants from Bosnia and Herzegovina are Immigrants from Russia (97.4%, a difference of 0.0%), French American Indian (97.4%, a difference of 0.0%), Immigrants from Jordan (97.4%, a difference of 0.0%), Albanian (97.4%, a difference of 0.010%), and Immigrants from Eastern Europe (97.4%, a difference of 0.020%).
| Demographics | Rating | Rank | 5th Grade |
| Immigrants | Israel | 79.1 /100 | #148 | Good 97.5% |
| Hopi | 78.6 /100 | #149 | Good 97.5% |
| Immigrants | South Central Asia | 78.6 /100 | #150 | Good 97.5% |
| Immigrants | Eastern Europe | 75.0 /100 | #151 | Good 97.4% |
| Ute | 74.9 /100 | #152 | Good 97.4% |
| Alsatians | 74.3 /100 | #153 | Good 97.4% |
| Immigrants | Russia | 71.2 /100 | #154 | Good 97.4% |
| Immigrants | Bosnia and Herzegovina | 71.0 /100 | #155 | Good 97.4% |
| French American Indians | 70.5 /100 | #156 | Good 97.4% |
| Immigrants | Jordan | 70.4 /100 | #157 | Good 97.4% |
| Albanians | 68.3 /100 | #158 | Good 97.4% |
| Immigrants | Italy | 65.2 /100 | #159 | Good 97.4% |
| Marshallese | 61.2 /100 | #160 | Good 97.4% |
| Kenyans | 59.7 /100 | #161 | Average 97.4% |
| Immigrants | Iran | 59.5 /100 | #162 | Average 97.4% |