Ecuadorian vs Delaware 5th Grade
COMPARE
Ecuadorian
Delaware
5th Grade
5th Grade Comparison
Ecuadorians
Delaware
96.0%
5TH GRADE
0.0/ 100
METRIC RATING
308th/ 347
METRIC RANK
97.8%
5TH GRADE
98.6/ 100
METRIC RATING
93rd/ 347
METRIC RANK
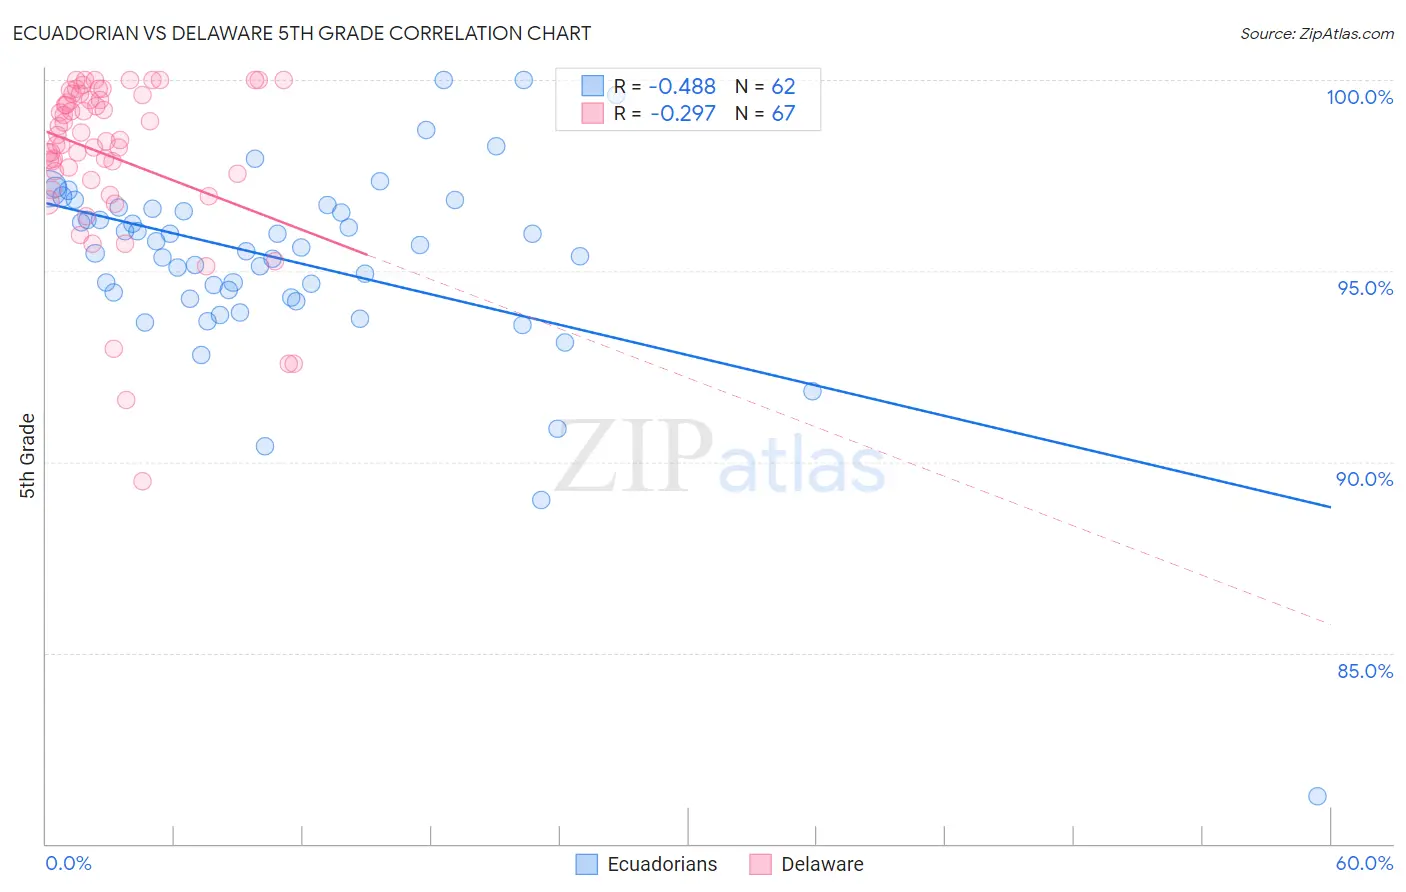
Ecuadorian vs Delaware 5th Grade Correlation Chart
The statistical analysis conducted on geographies consisting of 317,865,755 people shows a moderate negative correlation between the proportion of Ecuadorians and percentage of population with at least 5th grade education in the United States with a correlation coefficient (R) of -0.488 and weighted average of 96.0%. Similarly, the statistical analysis conducted on geographies consisting of 96,235,191 people shows a weak negative correlation between the proportion of Delaware and percentage of population with at least 5th grade education in the United States with a correlation coefficient (R) of -0.297 and weighted average of 97.8%, a difference of 1.8%.
5th Grade Correlation Summary
| Measurement | Ecuadorian | Delaware |
| Minimum | 81.2% | 89.5% |
| Maximum | 100.0% | 100.0% |
| Range | 18.7% | 10.5% |
| Mean | 95.2% | 98.0% |
| Median | 95.6% | 98.4% |
| Interquartile 25% (IQ1) | 94.3% | 97.4% |
| Interquartile 75% (IQ3) | 96.6% | 99.6% |
| Interquartile Range (IQR) | 2.3% | 2.2% |
| Standard Deviation (Sample) | 2.7% | 2.2% |
| Standard Deviation (Population) | 2.7% | 2.2% |
Similar Demographics by 5th Grade
Demographics Similar to Ecuadorians by 5th Grade
In terms of 5th grade, the demographic groups most similar to Ecuadorians are Immigrants from Haiti (96.0%, a difference of 0.010%), Immigrants from Caribbean (96.0%, a difference of 0.010%), Immigrants from Guyana (96.0%, a difference of 0.010%), Immigrants from Laos (96.0%, a difference of 0.030%), and Immigrants from Burma/Myanmar (96.1%, a difference of 0.040%).
| Demographics | Rating | Rank | 5th Grade |
| Immigrants | Cuba | 0.0 /100 | #301 | Tragic 96.1% |
| Guyanese | 0.0 /100 | #302 | Tragic 96.1% |
| Puerto Ricans | 0.0 /100 | #303 | Tragic 96.1% |
| Immigrants | Burma/Myanmar | 0.0 /100 | #304 | Tragic 96.1% |
| Immigrants | Laos | 0.0 /100 | #305 | Tragic 96.0% |
| Immigrants | Haiti | 0.0 /100 | #306 | Tragic 96.0% |
| Immigrants | Caribbean | 0.0 /100 | #307 | Tragic 96.0% |
| Ecuadorians | 0.0 /100 | #308 | Tragic 96.0% |
| Immigrants | Guyana | 0.0 /100 | #309 | Tragic 96.0% |
| Indonesians | 0.0 /100 | #310 | Tragic 96.0% |
| Immigrants | Bangladesh | 0.0 /100 | #311 | Tragic 96.0% |
| Vietnamese | 0.0 /100 | #312 | Tragic 95.9% |
| Bangladeshis | 0.0 /100 | #313 | Tragic 95.9% |
| Immigrants | Portugal | 0.0 /100 | #314 | Tragic 95.9% |
| Nicaraguans | 0.0 /100 | #315 | Tragic 95.9% |
Demographics Similar to Delaware by 5th Grade
In terms of 5th grade, the demographic groups most similar to Delaware are Immigrants from Denmark (97.8%, a difference of 0.0%), Immigrants from South Africa (97.8%, a difference of 0.010%), Immigrants from Ireland (97.8%, a difference of 0.010%), Immigrants from Western Europe (97.8%, a difference of 0.010%), and Immigrants from Sweden (97.8%, a difference of 0.010%).
| Demographics | Rating | Rank | 5th Grade |
| Cypriots | 98.9 /100 | #86 | Exceptional 97.8% |
| Immigrants | Australia | 98.8 /100 | #87 | Exceptional 97.8% |
| Shoshone | 98.8 /100 | #88 | Exceptional 97.8% |
| Immigrants | South Africa | 98.8 /100 | #89 | Exceptional 97.8% |
| Immigrants | Ireland | 98.8 /100 | #90 | Exceptional 97.8% |
| Immigrants | Western Europe | 98.8 /100 | #91 | Exceptional 97.8% |
| Immigrants | Sweden | 98.7 /100 | #92 | Exceptional 97.8% |
| Delaware | 98.6 /100 | #93 | Exceptional 97.8% |
| Immigrants | Denmark | 98.6 /100 | #94 | Exceptional 97.8% |
| Romanians | 98.6 /100 | #95 | Exceptional 97.8% |
| Immigrants | Germany | 98.5 /100 | #96 | Exceptional 97.8% |
| Cree | 98.4 /100 | #97 | Exceptional 97.7% |
| Yugoslavians | 98.3 /100 | #98 | Exceptional 97.7% |
| Turks | 98.3 /100 | #99 | Exceptional 97.7% |
| Puget Sound Salish | 98.3 /100 | #100 | Exceptional 97.7% |