Eastern European vs Central American Indian Nursery School
COMPARE
Eastern European
Central American Indian
Nursery School
Nursery School Comparison
Eastern Europeans
Central American Indians
98.5%
NURSERY SCHOOL
99.9/ 100
METRIC RATING
42nd/ 347
METRIC RANK
97.2%
NURSERY SCHOOL
0.0/ 100
METRIC RATING
298th/ 347
METRIC RANK
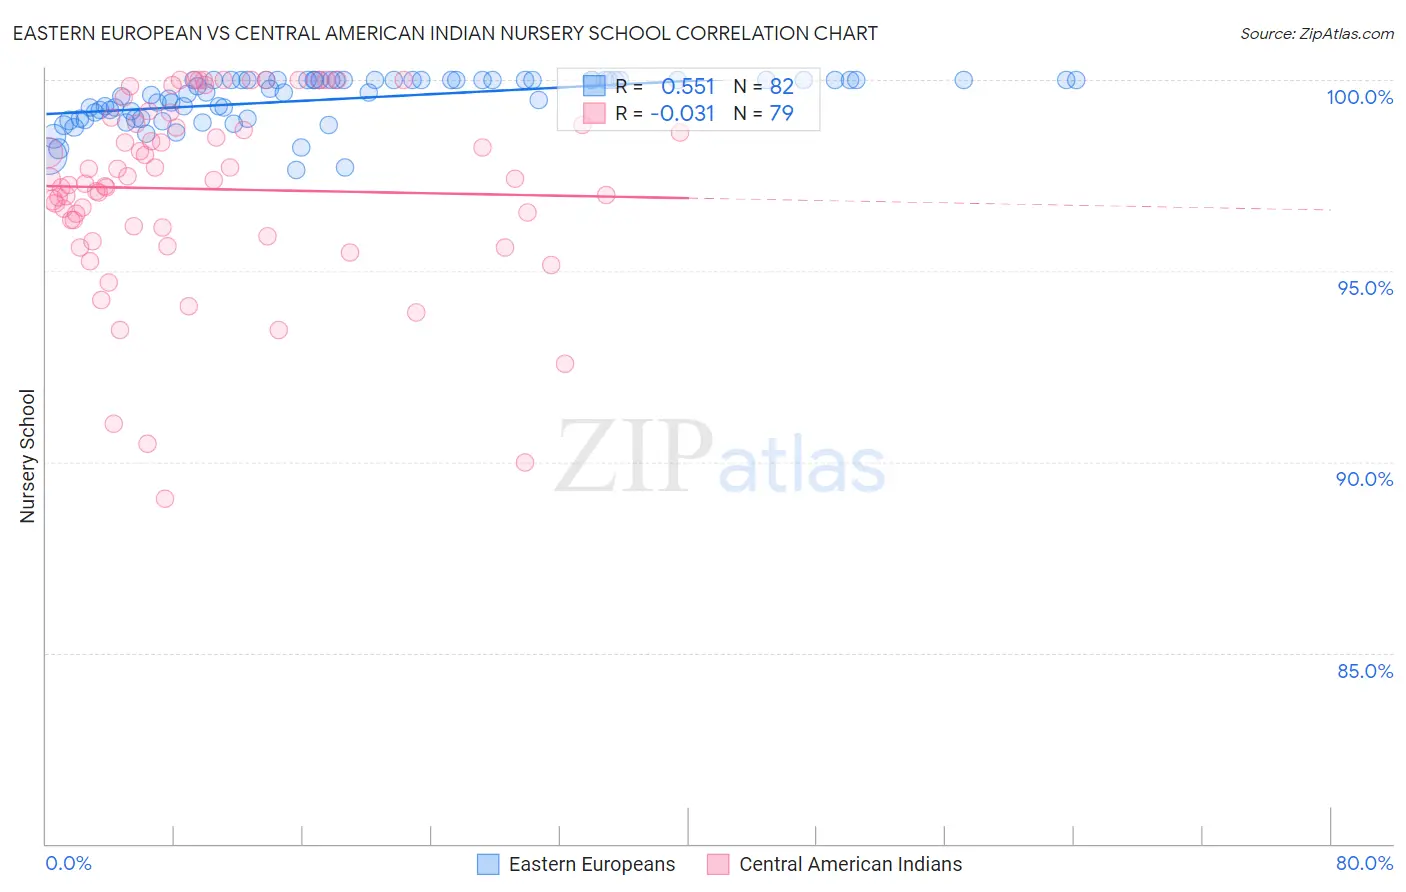
Eastern European vs Central American Indian Nursery School Correlation Chart
The statistical analysis conducted on geographies consisting of 461,247,661 people shows a substantial positive correlation between the proportion of Eastern Europeans and percentage of population with at least nursery school education in the United States with a correlation coefficient (R) of 0.551 and weighted average of 98.5%. Similarly, the statistical analysis conducted on geographies consisting of 326,141,567 people shows no correlation between the proportion of Central American Indians and percentage of population with at least nursery school education in the United States with a correlation coefficient (R) of -0.031 and weighted average of 97.2%, a difference of 1.4%.
Nursery School Correlation Summary
| Measurement | Eastern European | Central American Indian |
| Minimum | 97.7% | 89.0% |
| Maximum | 100.0% | 100.0% |
| Range | 2.3% | 11.0% |
| Mean | 99.5% | 97.1% |
| Median | 99.7% | 97.4% |
| Interquartile 25% (IQ1) | 99.0% | 96.2% |
| Interquartile 75% (IQ3) | 100.0% | 98.9% |
| Interquartile Range (IQR) | 1.00% | 2.7% |
| Standard Deviation (Sample) | 0.61% | 2.5% |
| Standard Deviation (Population) | 0.61% | 2.4% |
Similar Demographics by Nursery School
Demographics Similar to Eastern Europeans by Nursery School
In terms of nursery school, the demographic groups most similar to Eastern Europeans are Luxembourger (98.5%, a difference of 0.0%), Native Hawaiian (98.5%, a difference of 0.0%), Latvian (98.5%, a difference of 0.010%), Chippewa (98.5%, a difference of 0.010%), and Belgian (98.5%, a difference of 0.010%).
| Demographics | Rating | Rank | Nursery School |
| Swiss | 100.0 /100 | #35 | Exceptional 98.6% |
| British | 100.0 /100 | #36 | Exceptional 98.5% |
| Lumbee | 99.9 /100 | #37 | Exceptional 98.5% |
| Italians | 99.9 /100 | #38 | Exceptional 98.5% |
| Latvians | 99.9 /100 | #39 | Exceptional 98.5% |
| Chippewa | 99.9 /100 | #40 | Exceptional 98.5% |
| Luxembourgers | 99.9 /100 | #41 | Exceptional 98.5% |
| Eastern Europeans | 99.9 /100 | #42 | Exceptional 98.5% |
| Native Hawaiians | 99.9 /100 | #43 | Exceptional 98.5% |
| Belgians | 99.9 /100 | #44 | Exceptional 98.5% |
| Northern Europeans | 99.9 /100 | #45 | Exceptional 98.5% |
| Hungarians | 99.9 /100 | #46 | Exceptional 98.5% |
| Czechoslovakians | 99.9 /100 | #47 | Exceptional 98.5% |
| Ottawa | 99.8 /100 | #48 | Exceptional 98.5% |
| Whites/Caucasians | 99.8 /100 | #49 | Exceptional 98.5% |
Demographics Similar to Central American Indians by Nursery School
In terms of nursery school, the demographic groups most similar to Central American Indians are Immigrants from Cuba (97.2%, a difference of 0.010%), Immigrants from Dominica (97.2%, a difference of 0.010%), Haitian (97.2%, a difference of 0.020%), Immigrants from Eritrea (97.2%, a difference of 0.050%), and Immigrants from South Eastern Asia (97.1%, a difference of 0.050%).
| Demographics | Rating | Rank | Nursery School |
| British West Indians | 0.0 /100 | #291 | Tragic 97.3% |
| Houma | 0.0 /100 | #292 | Tragic 97.3% |
| Malaysians | 0.0 /100 | #293 | Tragic 97.3% |
| Immigrants | Grenada | 0.0 /100 | #294 | Tragic 97.3% |
| Immigrants | Immigrants | 0.0 /100 | #295 | Tragic 97.2% |
| Immigrants | Eritrea | 0.0 /100 | #296 | Tragic 97.2% |
| Immigrants | Cuba | 0.0 /100 | #297 | Tragic 97.2% |
| Central American Indians | 0.0 /100 | #298 | Tragic 97.2% |
| Immigrants | Dominica | 0.0 /100 | #299 | Tragic 97.2% |
| Haitians | 0.0 /100 | #300 | Tragic 97.2% |
| Immigrants | South Eastern Asia | 0.0 /100 | #301 | Tragic 97.1% |
| Immigrants | Caribbean | 0.0 /100 | #302 | Tragic 97.1% |
| Nicaraguans | 0.0 /100 | #303 | Tragic 97.1% |
| Ecuadorians | 0.0 /100 | #304 | Tragic 97.1% |
| Somalis | 0.0 /100 | #305 | Tragic 97.1% |