Cypriot vs Immigrants from Sierra Leone Nursery School
COMPARE
Cypriot
Immigrants from Sierra Leone
Nursery School
Nursery School Comparison
Cypriots
Immigrants from Sierra Leone
98.3%
NURSERY SCHOOL
98.3/ 100
METRIC RATING
96th/ 347
METRIC RANK
97.6%
NURSERY SCHOOL
0.3/ 100
METRIC RATING
266th/ 347
METRIC RANK
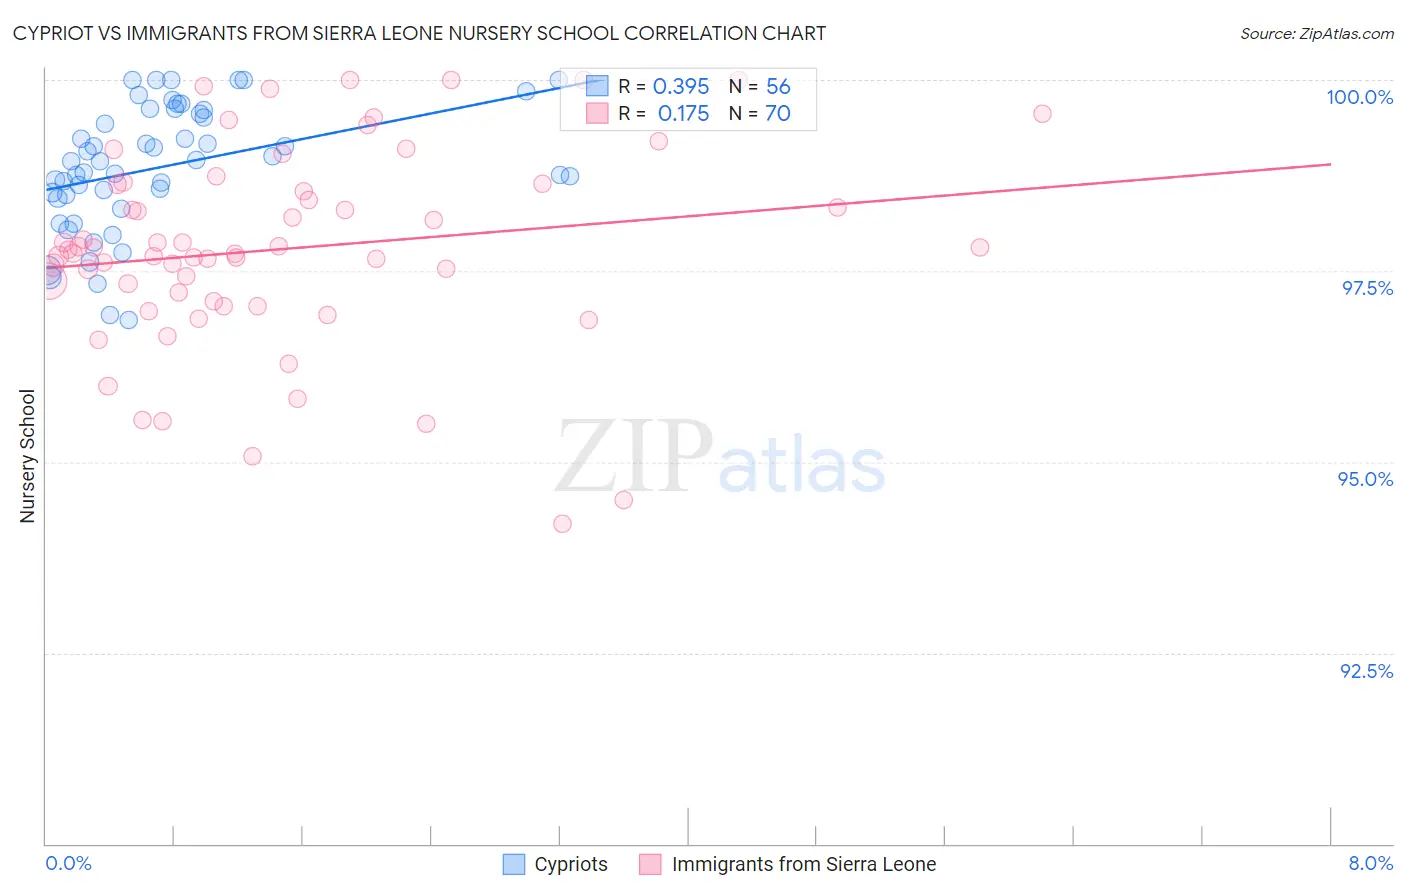
Cypriot vs Immigrants from Sierra Leone Nursery School Correlation Chart
The statistical analysis conducted on geographies consisting of 61,867,249 people shows a mild positive correlation between the proportion of Cypriots and percentage of population with at least nursery school education in the United States with a correlation coefficient (R) of 0.395 and weighted average of 98.3%. Similarly, the statistical analysis conducted on geographies consisting of 101,634,956 people shows a poor positive correlation between the proportion of Immigrants from Sierra Leone and percentage of population with at least nursery school education in the United States with a correlation coefficient (R) of 0.175 and weighted average of 97.6%, a difference of 0.75%.
Nursery School Correlation Summary
| Measurement | Cypriot | Immigrants from Sierra Leone |
| Minimum | 96.9% | 94.2% |
| Maximum | 100.0% | 100.0% |
| Range | 3.1% | 5.8% |
| Mean | 98.9% | 97.8% |
| Median | 98.9% | 97.8% |
| Interquartile 25% (IQ1) | 98.5% | 97.1% |
| Interquartile 75% (IQ3) | 99.6% | 98.6% |
| Interquartile Range (IQR) | 1.1% | 1.5% |
| Standard Deviation (Sample) | 0.82% | 1.3% |
| Standard Deviation (Population) | 0.81% | 1.3% |
Similar Demographics by Nursery School
Demographics Similar to Cypriots by Nursery School
In terms of nursery school, the demographic groups most similar to Cypriots are Nonimmigrants (98.3%, a difference of 0.0%), Choctaw (98.3%, a difference of 0.0%), Immigrants from Germany (98.3%, a difference of 0.010%), South African (98.3%, a difference of 0.010%), and Colville (98.3%, a difference of 0.010%).
| Demographics | Rating | Rank | Nursery School |
| Immigrants | South Africa | 98.8 /100 | #89 | Exceptional 98.3% |
| Immigrants | Western Europe | 98.8 /100 | #90 | Exceptional 98.3% |
| Zimbabweans | 98.8 /100 | #91 | Exceptional 98.3% |
| Macedonians | 98.7 /100 | #92 | Exceptional 98.3% |
| Immigrants | India | 98.7 /100 | #93 | Exceptional 98.3% |
| Immigrants | Germany | 98.6 /100 | #94 | Exceptional 98.3% |
| South Africans | 98.6 /100 | #95 | Exceptional 98.3% |
| Cypriots | 98.3 /100 | #96 | Exceptional 98.3% |
| Immigrants | Nonimmigrants | 98.3 /100 | #97 | Exceptional 98.3% |
| Choctaw | 98.3 /100 | #98 | Exceptional 98.3% |
| Colville | 98.2 /100 | #99 | Exceptional 98.3% |
| Puget Sound Salish | 98.0 /100 | #100 | Exceptional 98.3% |
| Romanians | 97.9 /100 | #101 | Exceptional 98.3% |
| Immigrants | Ireland | 97.7 /100 | #102 | Exceptional 98.3% |
| Cree | 97.7 /100 | #103 | Exceptional 98.3% |
Demographics Similar to Immigrants from Sierra Leone by Nursery School
In terms of nursery school, the demographic groups most similar to Immigrants from Sierra Leone are Immigrants from Ethiopia (97.6%, a difference of 0.010%), Fijian (97.6%, a difference of 0.010%), Taiwanese (97.6%, a difference of 0.010%), Assyrian/Chaldean/Syriac (97.6%, a difference of 0.010%), and Immigrants from Nigeria (97.5%, a difference of 0.010%).
| Demographics | Rating | Rank | Nursery School |
| Armenians | 0.4 /100 | #259 | Tragic 97.6% |
| Immigrants | South America | 0.4 /100 | #260 | Tragic 97.6% |
| Cubans | 0.4 /100 | #261 | Tragic 97.6% |
| Immigrants | Ethiopia | 0.4 /100 | #262 | Tragic 97.6% |
| Fijians | 0.3 /100 | #263 | Tragic 97.6% |
| Taiwanese | 0.3 /100 | #264 | Tragic 97.6% |
| Assyrians/Chaldeans/Syriacs | 0.3 /100 | #265 | Tragic 97.6% |
| Immigrants | Sierra Leone | 0.3 /100 | #266 | Tragic 97.6% |
| Immigrants | Nigeria | 0.3 /100 | #267 | Tragic 97.5% |
| West Indians | 0.3 /100 | #268 | Tragic 97.5% |
| Immigrants | Liberia | 0.3 /100 | #269 | Tragic 97.5% |
| Immigrants | Jamaica | 0.2 /100 | #270 | Tragic 97.5% |
| Immigrants | Peru | 0.2 /100 | #271 | Tragic 97.5% |
| Immigrants | Bolivia | 0.1 /100 | #272 | Tragic 97.5% |
| Immigrants | China | 0.1 /100 | #273 | Tragic 97.5% |