Croatian vs Immigrants from Dominican Republic College, Under 1 year
COMPARE
Croatian
Immigrants from Dominican Republic
College, Under 1 year
College, Under 1 year Comparison
Croatians
Immigrants from Dominican Republic
68.3%
COLLEGE, UNDER 1 YEAR
98.2/ 100
METRIC RATING
88th/ 347
METRIC RANK
54.0%
COLLEGE, UNDER 1 YEAR
0.0/ 100
METRIC RATING
339th/ 347
METRIC RANK
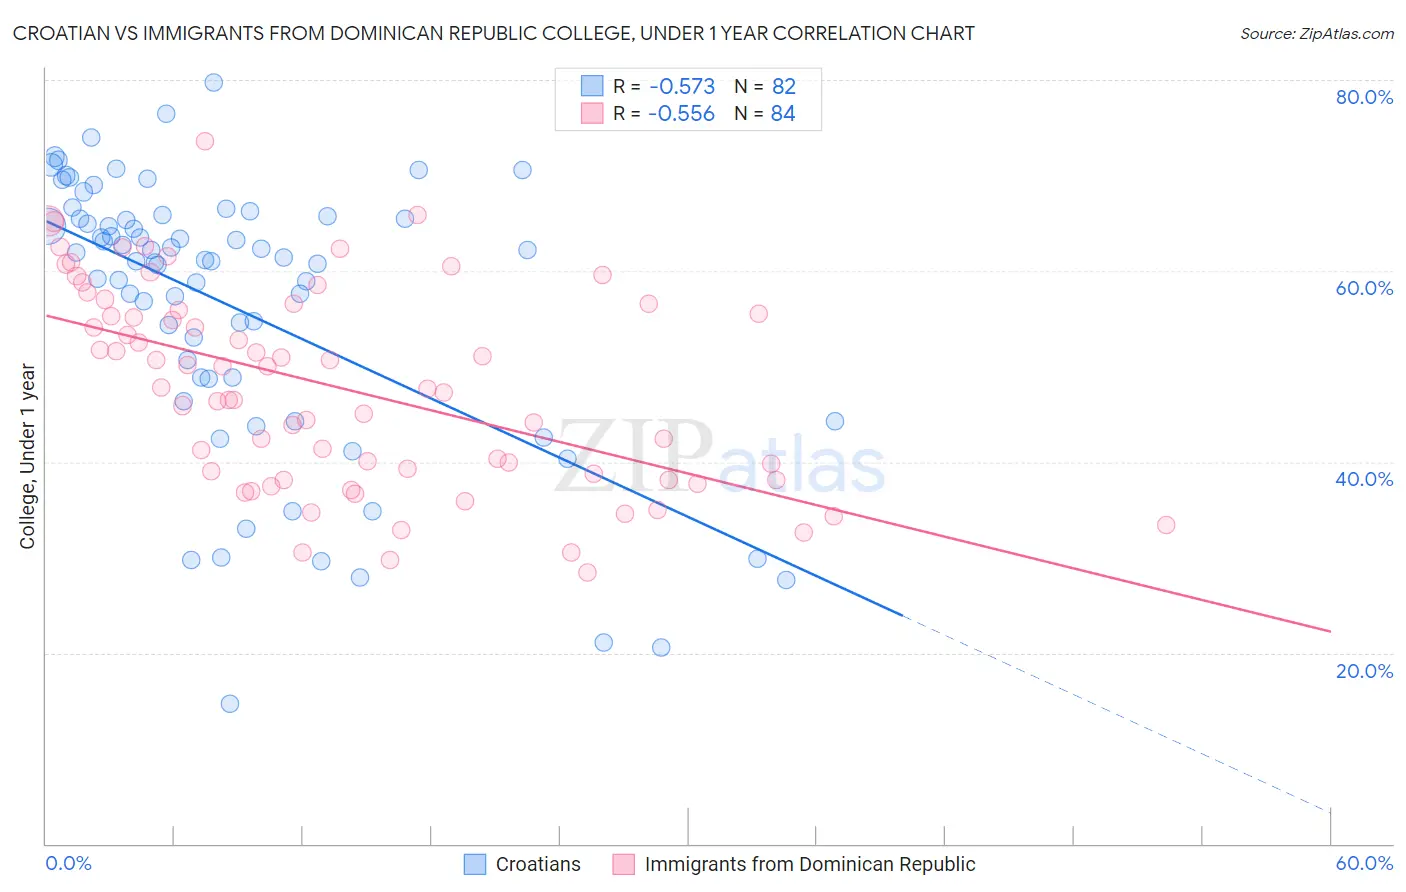
Croatian vs Immigrants from Dominican Republic College, Under 1 year Correlation Chart
The statistical analysis conducted on geographies consisting of 375,730,237 people shows a substantial negative correlation between the proportion of Croatians and percentage of population with at least college, under 1 year education in the United States with a correlation coefficient (R) of -0.573 and weighted average of 68.3%. Similarly, the statistical analysis conducted on geographies consisting of 275,143,955 people shows a substantial negative correlation between the proportion of Immigrants from Dominican Republic and percentage of population with at least college, under 1 year education in the United States with a correlation coefficient (R) of -0.556 and weighted average of 54.0%, a difference of 26.5%.
College, Under 1 year Correlation Summary
| Measurement | Croatian | Immigrants from Dominican Republic |
| Minimum | 14.6% | 28.4% |
| Maximum | 79.7% | 73.5% |
| Range | 65.1% | 45.1% |
| Mean | 56.1% | 47.8% |
| Median | 61.1% | 47.7% |
| Interquartile 25% (IQ1) | 48.7% | 38.5% |
| Interquartile 75% (IQ3) | 65.5% | 56.2% |
| Interquartile Range (IQR) | 16.8% | 17.7% |
| Standard Deviation (Sample) | 14.5% | 10.5% |
| Standard Deviation (Population) | 14.5% | 10.4% |
Similar Demographics by College, Under 1 year
Demographics Similar to Croatians by College, Under 1 year
In terms of college, under 1 year, the demographic groups most similar to Croatians are Ethiopian (68.3%, a difference of 0.010%), Chinese (68.3%, a difference of 0.020%), Immigrants from Lebanon (68.3%, a difference of 0.040%), Immigrants from Hungary (68.3%, a difference of 0.050%), and Egyptian (68.3%, a difference of 0.050%).
| Demographics | Rating | Rank | College, Under 1 year |
| Immigrants | Greece | 98.5 /100 | #81 | Exceptional 68.4% |
| Norwegians | 98.4 /100 | #82 | Exceptional 68.4% |
| Argentineans | 98.4 /100 | #83 | Exceptional 68.4% |
| Immigrants | Hungary | 98.3 /100 | #84 | Exceptional 68.3% |
| Egyptians | 98.3 /100 | #85 | Exceptional 68.3% |
| Immigrants | Lebanon | 98.3 /100 | #86 | Exceptional 68.3% |
| Chinese | 98.3 /100 | #87 | Exceptional 68.3% |
| Croatians | 98.2 /100 | #88 | Exceptional 68.3% |
| Ethiopians | 98.2 /100 | #89 | Exceptional 68.3% |
| Icelanders | 98.1 /100 | #90 | Exceptional 68.3% |
| Europeans | 98.1 /100 | #91 | Exceptional 68.2% |
| Luxembourgers | 98.1 /100 | #92 | Exceptional 68.2% |
| Romanians | 97.9 /100 | #93 | Exceptional 68.2% |
| Armenians | 97.7 /100 | #94 | Exceptional 68.1% |
| Immigrants | Pakistan | 97.5 /100 | #95 | Exceptional 68.0% |
Demographics Similar to Immigrants from Dominican Republic by College, Under 1 year
In terms of college, under 1 year, the demographic groups most similar to Immigrants from Dominican Republic are Spanish American Indian (54.0%, a difference of 0.090%), Lumbee (54.2%, a difference of 0.40%), Immigrants from Cabo Verde (53.7%, a difference of 0.59%), Immigrants from Mexico (53.7%, a difference of 0.65%), and Immigrants from Central America (54.4%, a difference of 0.81%).
| Demographics | Rating | Rank | College, Under 1 year |
| Immigrants | Yemen | 0.0 /100 | #332 | Tragic 55.3% |
| Yuman | 0.0 /100 | #333 | Tragic 55.1% |
| Immigrants | Azores | 0.0 /100 | #334 | Tragic 54.7% |
| Inupiat | 0.0 /100 | #335 | Tragic 54.6% |
| Pennsylvania Germans | 0.0 /100 | #336 | Tragic 54.5% |
| Immigrants | Central America | 0.0 /100 | #337 | Tragic 54.4% |
| Lumbee | 0.0 /100 | #338 | Tragic 54.2% |
| Immigrants | Dominican Republic | 0.0 /100 | #339 | Tragic 54.0% |
| Spanish American Indians | 0.0 /100 | #340 | Tragic 54.0% |
| Immigrants | Cabo Verde | 0.0 /100 | #341 | Tragic 53.7% |
| Immigrants | Mexico | 0.0 /100 | #342 | Tragic 53.7% |
| Tohono O'odham | 0.0 /100 | #343 | Tragic 52.8% |
| Yakama | 0.0 /100 | #344 | Tragic 52.6% |
| Pima | 0.0 /100 | #345 | Tragic 51.4% |
| Houma | 0.0 /100 | #346 | Tragic 47.6% |