Creek vs Immigrants from Guatemala 12th Grade, No Diploma
COMPARE
Creek
Immigrants from Guatemala
12th Grade, No Diploma
12th Grade, No Diploma Comparison
Creek
Immigrants from Guatemala
90.3%
12TH GRADE, NO DIPLOMA
3.9/ 100
METRIC RATING
228th/ 347
METRIC RANK
84.0%
12TH GRADE, NO DIPLOMA
0.0/ 100
METRIC RATING
341st/ 347
METRIC RANK
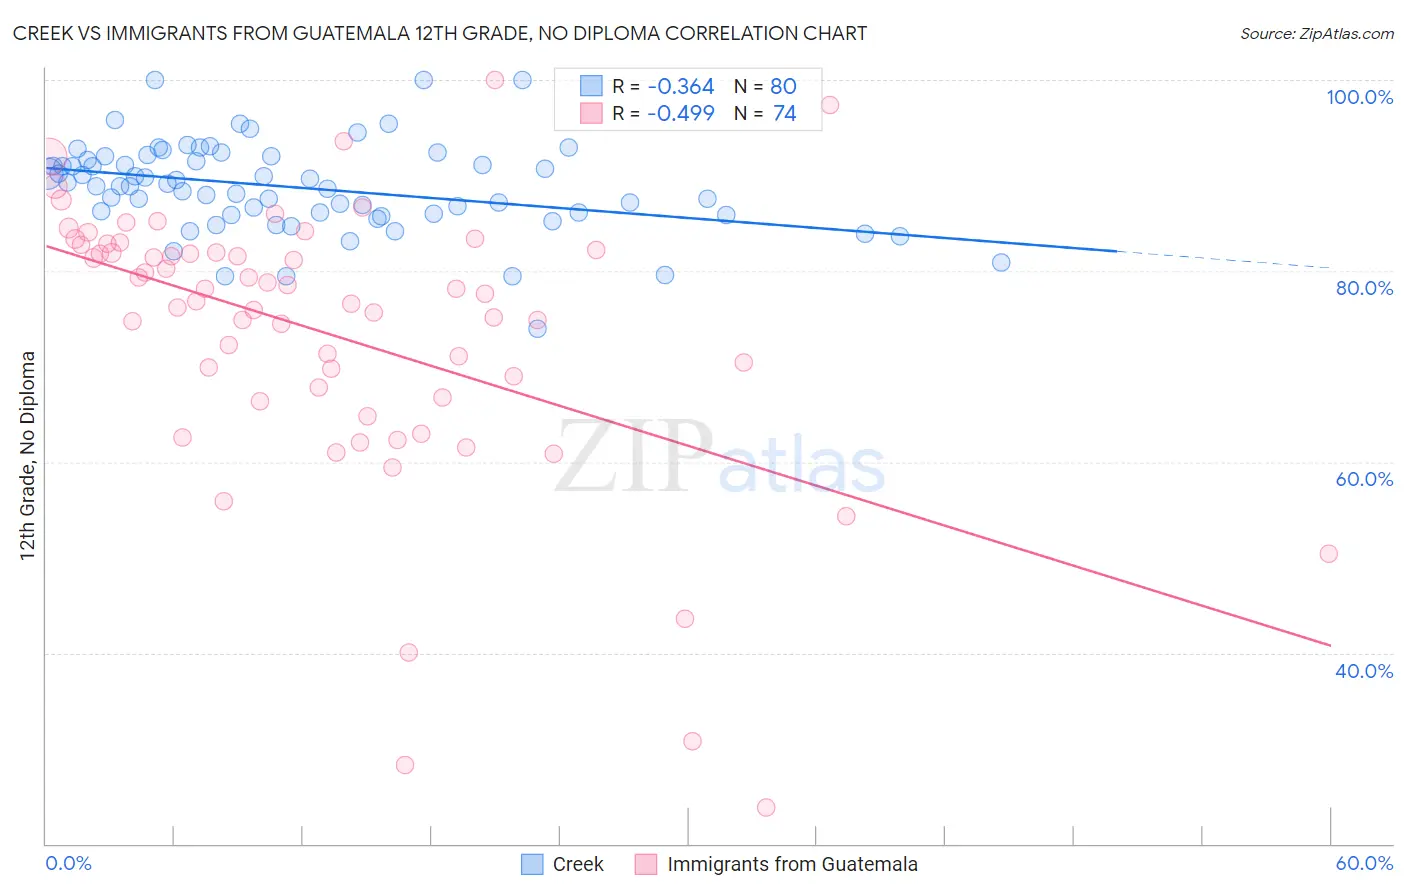
Creek vs Immigrants from Guatemala 12th Grade, No Diploma Correlation Chart
The statistical analysis conducted on geographies consisting of 178,480,629 people shows a mild negative correlation between the proportion of Creek and percentage of population with at least 12th grade (no diploma) education in the United States with a correlation coefficient (R) of -0.364 and weighted average of 90.3%. Similarly, the statistical analysis conducted on geographies consisting of 377,286,142 people shows a moderate negative correlation between the proportion of Immigrants from Guatemala and percentage of population with at least 12th grade (no diploma) education in the United States with a correlation coefficient (R) of -0.499 and weighted average of 84.0%, a difference of 7.4%.
12th Grade, No Diploma Correlation Summary
| Measurement | Creek | Immigrants from Guatemala |
| Minimum | 74.0% | 23.9% |
| Maximum | 100.0% | 100.0% |
| Range | 26.0% | 76.1% |
| Mean | 88.7% | 73.4% |
| Median | 88.9% | 77.2% |
| Interquartile 25% (IQ1) | 86.0% | 66.8% |
| Interquartile 75% (IQ3) | 91.8% | 82.2% |
| Interquartile Range (IQR) | 5.8% | 15.4% |
| Standard Deviation (Sample) | 4.7% | 14.7% |
| Standard Deviation (Population) | 4.7% | 14.6% |
Similar Demographics by 12th Grade, No Diploma
Demographics Similar to Creek by 12th Grade, No Diploma
In terms of 12th grade, no diploma, the demographic groups most similar to Creek are Immigrants from Bahamas (90.2%, a difference of 0.020%), Immigrants from Zaire (90.3%, a difference of 0.050%), Nigerian (90.3%, a difference of 0.050%), Immigrants from Panama (90.3%, a difference of 0.070%), and Chickasaw (90.3%, a difference of 0.070%).
| Demographics | Rating | Rank | 12th Grade, No Diploma |
| Immigrants | Liberia | 5.7 /100 | #221 | Tragic 90.4% |
| Immigrants | Somalia | 5.3 /100 | #222 | Tragic 90.4% |
| South Americans | 5.0 /100 | #223 | Tragic 90.3% |
| Immigrants | Panama | 4.8 /100 | #224 | Tragic 90.3% |
| Chickasaw | 4.8 /100 | #225 | Tragic 90.3% |
| Immigrants | Zaire | 4.6 /100 | #226 | Tragic 90.3% |
| Nigerians | 4.5 /100 | #227 | Tragic 90.3% |
| Creek | 3.9 /100 | #228 | Tragic 90.3% |
| Immigrants | Bahamas | 3.6 /100 | #229 | Tragic 90.2% |
| Immigrants | Philippines | 2.8 /100 | #230 | Tragic 90.2% |
| Peruvians | 2.7 /100 | #231 | Tragic 90.2% |
| Blackfeet | 2.4 /100 | #232 | Tragic 90.1% |
| Immigrants | Thailand | 2.3 /100 | #233 | Tragic 90.1% |
| Immigrants | South America | 2.3 /100 | #234 | Tragic 90.1% |
| Colville | 2.3 /100 | #235 | Tragic 90.1% |
Demographics Similar to Immigrants from Guatemala by 12th Grade, No Diploma
In terms of 12th grade, no diploma, the demographic groups most similar to Immigrants from Guatemala are Mexican (84.1%, a difference of 0.14%), Houma (83.7%, a difference of 0.34%), Immigrants from El Salvador (83.6%, a difference of 0.51%), Salvadoran (84.5%, a difference of 0.56%), and Guatemalan (84.6%, a difference of 0.65%).
| Demographics | Rating | Rank | 12th Grade, No Diploma |
| Immigrants | Latin America | 0.0 /100 | #333 | Tragic 85.0% |
| Immigrants | Dominican Republic | 0.0 /100 | #334 | Tragic 84.9% |
| Immigrants | Yemen | 0.0 /100 | #335 | Tragic 84.8% |
| Tohono O'odham | 0.0 /100 | #336 | Tragic 84.7% |
| Pima | 0.0 /100 | #337 | Tragic 84.6% |
| Guatemalans | 0.0 /100 | #338 | Tragic 84.6% |
| Salvadorans | 0.0 /100 | #339 | Tragic 84.5% |
| Mexicans | 0.0 /100 | #340 | Tragic 84.1% |
| Immigrants | Guatemala | 0.0 /100 | #341 | Tragic 84.0% |
| Houma | 0.0 /100 | #342 | Tragic 83.7% |
| Immigrants | El Salvador | 0.0 /100 | #343 | Tragic 83.6% |
| Immigrants | Central America | 0.0 /100 | #344 | Tragic 83.0% |
| Spanish American Indians | 0.0 /100 | #345 | Tragic 82.9% |
| Yakama | 0.0 /100 | #346 | Tragic 82.5% |
| Immigrants | Mexico | 0.0 /100 | #347 | Tragic 82.4% |