Costa Rican vs Immigrants from Haiti 10th Grade
COMPARE
Costa Rican
Immigrants from Haiti
10th Grade
10th Grade Comparison
Costa Ricans
Immigrants from Haiti
93.1%
10TH GRADE
4.2/ 100
METRIC RATING
239th/ 347
METRIC RANK
91.4%
10TH GRADE
0.0/ 100
METRIC RATING
299th/ 347
METRIC RANK
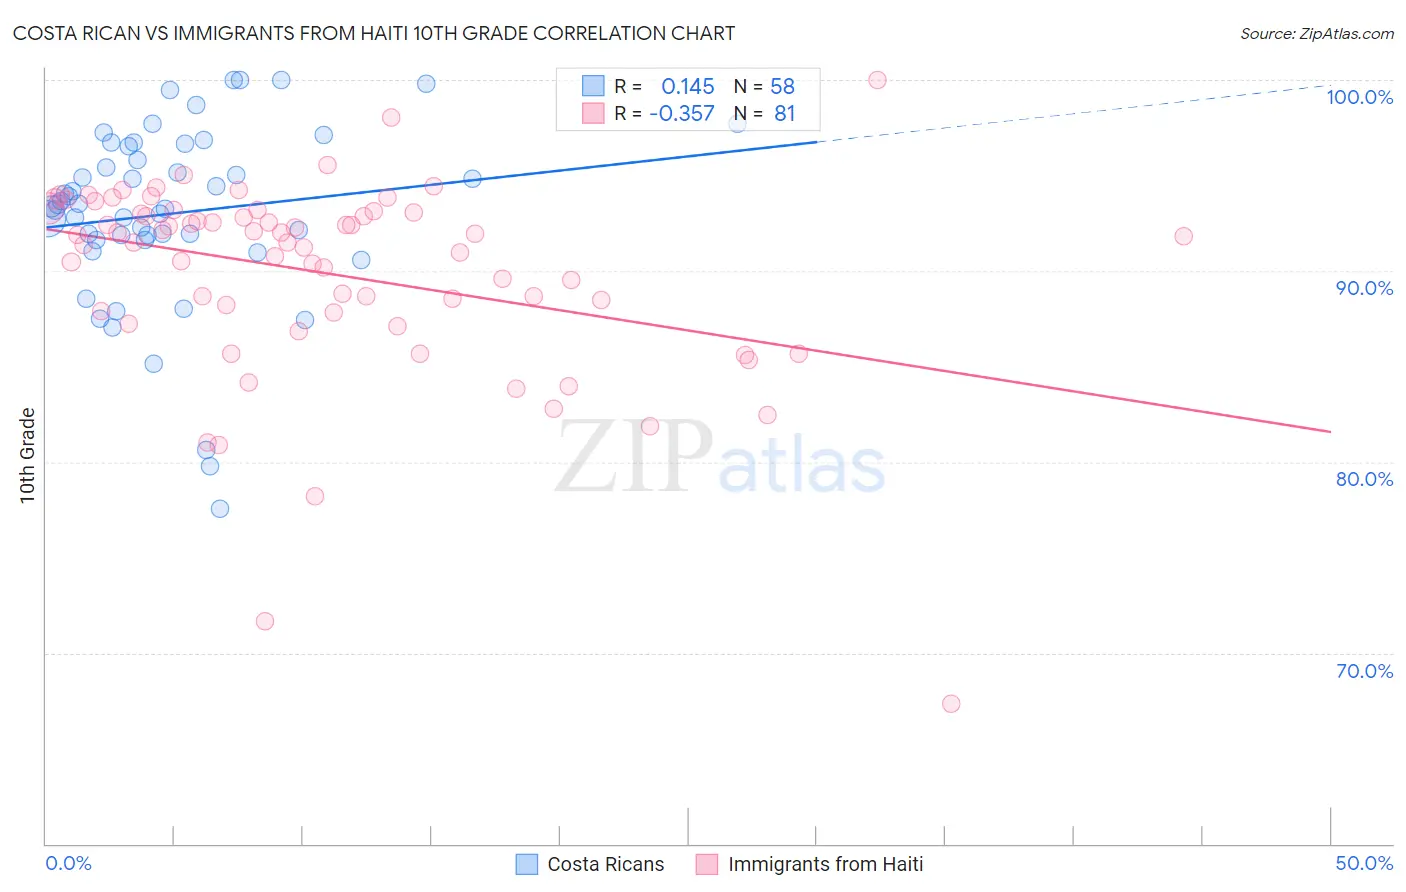
Costa Rican vs Immigrants from Haiti 10th Grade Correlation Chart
The statistical analysis conducted on geographies consisting of 253,601,730 people shows a poor positive correlation between the proportion of Costa Ricans and percentage of population with at least 10th grade education in the United States with a correlation coefficient (R) of 0.145 and weighted average of 93.1%. Similarly, the statistical analysis conducted on geographies consisting of 225,286,322 people shows a mild negative correlation between the proportion of Immigrants from Haiti and percentage of population with at least 10th grade education in the United States with a correlation coefficient (R) of -0.357 and weighted average of 91.4%, a difference of 1.8%.
10th Grade Correlation Summary
| Measurement | Costa Rican | Immigrants from Haiti |
| Minimum | 77.5% | 67.3% |
| Maximum | 100.0% | 100.0% |
| Range | 22.5% | 32.7% |
| Mean | 93.0% | 89.9% |
| Median | 93.4% | 91.8% |
| Interquartile 25% (IQ1) | 91.6% | 87.9% |
| Interquartile 75% (IQ3) | 96.5% | 93.1% |
| Interquartile Range (IQR) | 4.9% | 5.2% |
| Standard Deviation (Sample) | 4.7% | 5.2% |
| Standard Deviation (Population) | 4.7% | 5.2% |
Similar Demographics by 10th Grade
Demographics Similar to Costa Ricans by 10th Grade
In terms of 10th grade, the demographic groups most similar to Costa Ricans are Nigerian (93.1%, a difference of 0.0%), Immigrants from Hong Kong (93.1%, a difference of 0.0%), Immigrants from Panama (93.1%, a difference of 0.010%), African (93.1%, a difference of 0.020%), and Afghan (93.1%, a difference of 0.020%).
| Demographics | Rating | Rank | 10th Grade |
| Bahamians | 4.9 /100 | #232 | Tragic 93.1% |
| Comanche | 4.9 /100 | #233 | Tragic 93.1% |
| Sub-Saharan Africans | 4.7 /100 | #234 | Tragic 93.1% |
| Africans | 4.6 /100 | #235 | Tragic 93.1% |
| Afghans | 4.5 /100 | #236 | Tragic 93.1% |
| Immigrants | Panama | 4.3 /100 | #237 | Tragic 93.1% |
| Nigerians | 4.2 /100 | #238 | Tragic 93.1% |
| Costa Ricans | 4.2 /100 | #239 | Tragic 93.1% |
| Immigrants | Hong Kong | 4.2 /100 | #240 | Tragic 93.1% |
| Immigrants | Somalia | 2.7 /100 | #241 | Tragic 93.0% |
| Immigrants | Cameroon | 2.6 /100 | #242 | Tragic 93.0% |
| Senegalese | 2.4 /100 | #243 | Tragic 93.0% |
| Spanish Americans | 2.1 /100 | #244 | Tragic 92.9% |
| Uruguayans | 1.8 /100 | #245 | Tragic 92.9% |
| Immigrants | Middle Africa | 1.7 /100 | #246 | Tragic 92.9% |
Demographics Similar to Immigrants from Haiti by 10th Grade
In terms of 10th grade, the demographic groups most similar to Immigrants from Haiti are Guyanese (91.4%, a difference of 0.050%), Cuban (91.5%, a difference of 0.080%), Fijian (91.5%, a difference of 0.10%), Japanese (91.2%, a difference of 0.19%), and Immigrants from Guyana (91.2%, a difference of 0.20%).
| Demographics | Rating | Rank | 10th Grade |
| Immigrants | Burma/Myanmar | 0.0 /100 | #292 | Tragic 91.8% |
| Indonesians | 0.0 /100 | #293 | Tragic 91.8% |
| Haitians | 0.0 /100 | #294 | Tragic 91.8% |
| Lumbee | 0.0 /100 | #295 | Tragic 91.7% |
| Immigrants | Grenada | 0.0 /100 | #296 | Tragic 91.6% |
| Fijians | 0.0 /100 | #297 | Tragic 91.5% |
| Cubans | 0.0 /100 | #298 | Tragic 91.5% |
| Immigrants | Haiti | 0.0 /100 | #299 | Tragic 91.4% |
| Guyanese | 0.0 /100 | #300 | Tragic 91.4% |
| Japanese | 0.0 /100 | #301 | Tragic 91.2% |
| Immigrants | Guyana | 0.0 /100 | #302 | Tragic 91.2% |
| Immigrants | Vietnam | 0.0 /100 | #303 | Tragic 91.2% |
| Pima | 0.0 /100 | #304 | Tragic 91.2% |
| Immigrants | Dominica | 0.0 /100 | #305 | Tragic 91.1% |
| Yaqui | 0.0 /100 | #306 | Tragic 91.1% |