Costa Rican vs Alaskan Athabascan Kindergarten
COMPARE
Costa Rican
Alaskan Athabascan
Kindergarten
Kindergarten Comparison
Costa Ricans
Alaskan Athabascans
97.8%
KINDERGARTEN
11.6/ 100
METRIC RATING
209th/ 347
METRIC RANK
98.8%
KINDERGARTEN
100.0/ 100
METRIC RATING
6th/ 347
METRIC RANK
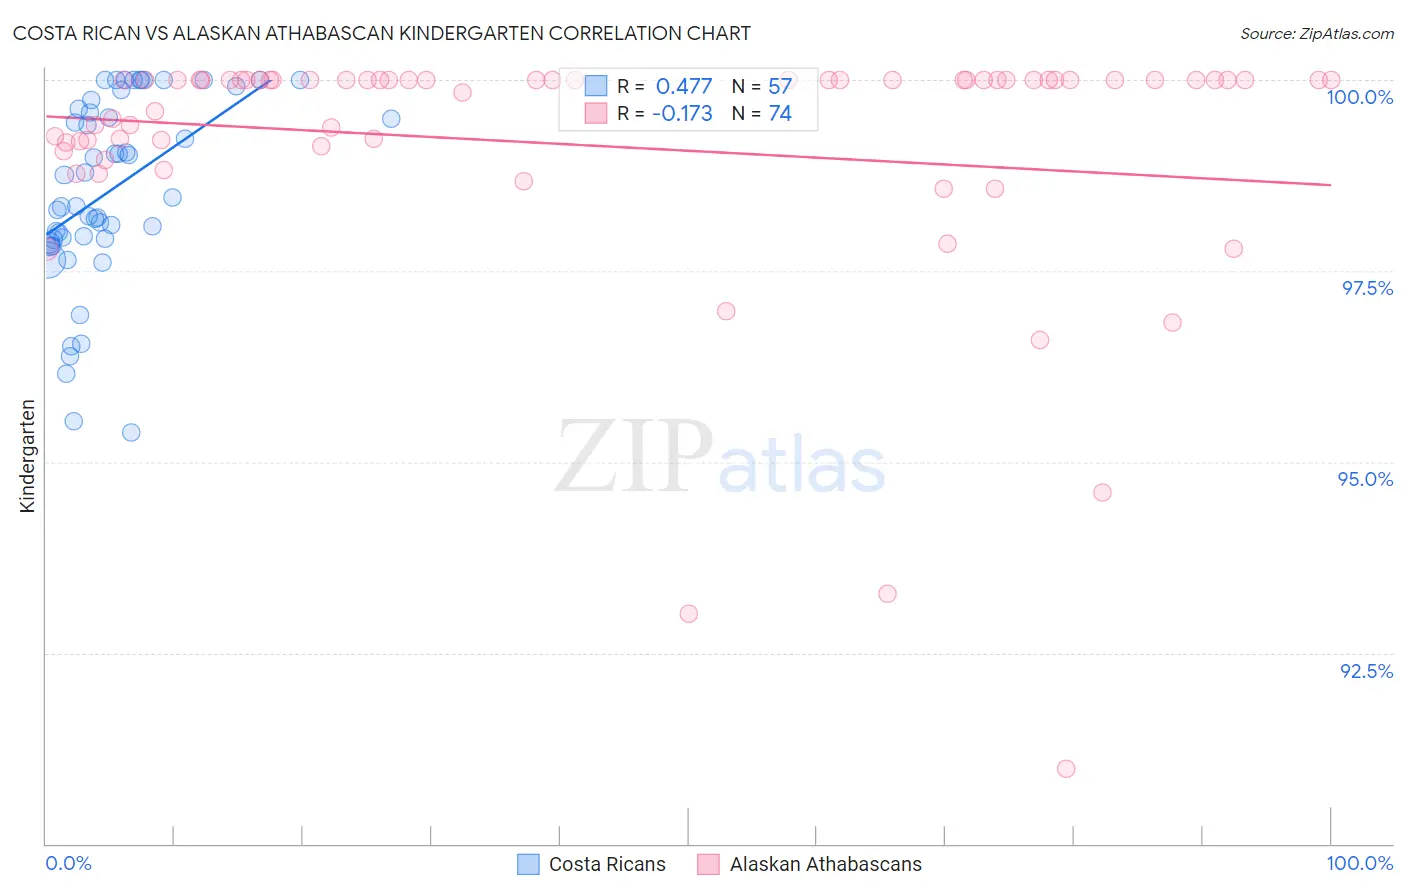
Costa Rican vs Alaskan Athabascan Kindergarten Correlation Chart
The statistical analysis conducted on geographies consisting of 253,599,979 people shows a moderate positive correlation between the proportion of Costa Ricans and percentage of population with at least kindergarten education in the United States with a correlation coefficient (R) of 0.477 and weighted average of 97.8%. Similarly, the statistical analysis conducted on geographies consisting of 45,820,365 people shows a poor negative correlation between the proportion of Alaskan Athabascans and percentage of population with at least kindergarten education in the United States with a correlation coefficient (R) of -0.173 and weighted average of 98.8%, a difference of 1.0%.
Kindergarten Correlation Summary
| Measurement | Costa Rican | Alaskan Athabascan |
| Minimum | 95.4% | 91.0% |
| Maximum | 100.0% | 100.0% |
| Range | 4.6% | 9.0% |
| Mean | 98.6% | 99.1% |
| Median | 98.5% | 100.0% |
| Interquartile 25% (IQ1) | 97.9% | 99.1% |
| Interquartile 75% (IQ3) | 99.7% | 100.0% |
| Interquartile Range (IQR) | 1.8% | 0.87% |
| Standard Deviation (Sample) | 1.2% | 1.7% |
| Standard Deviation (Population) | 1.2% | 1.7% |
Similar Demographics by Kindergarten
Demographics Similar to Costa Ricans by Kindergarten
In terms of kindergarten, the demographic groups most similar to Costa Ricans are Immigrants from Northern Africa (97.8%, a difference of 0.0%), Immigrants from Oceania (97.8%, a difference of 0.0%), Laotian (97.8%, a difference of 0.010%), Moroccan (97.8%, a difference of 0.020%), and Immigrants from Albania (97.8%, a difference of 0.030%).
| Demographics | Rating | Rank | Kindergarten |
| Immigrants | Ukraine | 19.1 /100 | #202 | Poor 97.8% |
| Immigrants | Uganda | 18.8 /100 | #203 | Poor 97.8% |
| Immigrants | Chile | 18.1 /100 | #204 | Poor 97.8% |
| Immigrants | Southern Europe | 18.0 /100 | #205 | Poor 97.8% |
| Immigrants | Albania | 16.4 /100 | #206 | Poor 97.8% |
| Africans | 16.1 /100 | #207 | Poor 97.8% |
| Immigrants | Northern Africa | 12.0 /100 | #208 | Poor 97.8% |
| Costa Ricans | 11.6 /100 | #209 | Poor 97.8% |
| Immigrants | Oceania | 11.1 /100 | #210 | Poor 97.8% |
| Laotians | 10.5 /100 | #211 | Poor 97.8% |
| Moroccans | 8.9 /100 | #212 | Tragic 97.8% |
| South American Indians | 7.7 /100 | #213 | Tragic 97.8% |
| Uruguayans | 7.5 /100 | #214 | Tragic 97.8% |
| Immigrants | Bahamas | 7.4 /100 | #215 | Tragic 97.8% |
| Samoans | 6.9 /100 | #216 | Tragic 97.8% |
Demographics Similar to Alaskan Athabascans by Kindergarten
In terms of kindergarten, the demographic groups most similar to Alaskan Athabascans are Alaska Native (98.7%, a difference of 0.040%), Norwegian (98.7%, a difference of 0.060%), Tsimshian (98.8%, a difference of 0.070%), Tlingit-Haida (98.7%, a difference of 0.080%), and Slovak (98.7%, a difference of 0.080%).
| Demographics | Rating | Rank | Kindergarten |
| Crow | 100.0 /100 | #1 | Exceptional 99.7% |
| Yup'ik | 100.0 /100 | #2 | Exceptional 99.2% |
| Inupiat | 100.0 /100 | #3 | Exceptional 98.9% |
| Welsh | 100.0 /100 | #4 | Exceptional 98.9% |
| Tsimshian | 100.0 /100 | #5 | Exceptional 98.8% |
| Alaskan Athabascans | 100.0 /100 | #6 | Exceptional 98.8% |
| Alaska Natives | 100.0 /100 | #7 | Exceptional 98.7% |
| Norwegians | 100.0 /100 | #8 | Exceptional 98.7% |
| Tlingit-Haida | 100.0 /100 | #9 | Exceptional 98.7% |
| Slovaks | 100.0 /100 | #10 | Exceptional 98.7% |
| Germans | 100.0 /100 | #11 | Exceptional 98.7% |
| Slovenes | 100.0 /100 | #12 | Exceptional 98.7% |
| Carpatho Rusyns | 100.0 /100 | #13 | Exceptional 98.7% |
| English | 100.0 /100 | #14 | Exceptional 98.7% |
| Swedes | 100.0 /100 | #15 | Exceptional 98.7% |