Colville vs Dutch West Indian Nursery School
COMPARE
Colville
Dutch West Indian
Nursery School
Nursery School Comparison
Colville
Dutch West Indians
98.3%
NURSERY SCHOOL
98.2/ 100
METRIC RATING
99th/ 347
METRIC RANK
98.0%
NURSERY SCHOOL
70.2/ 100
METRIC RATING
152nd/ 347
METRIC RANK
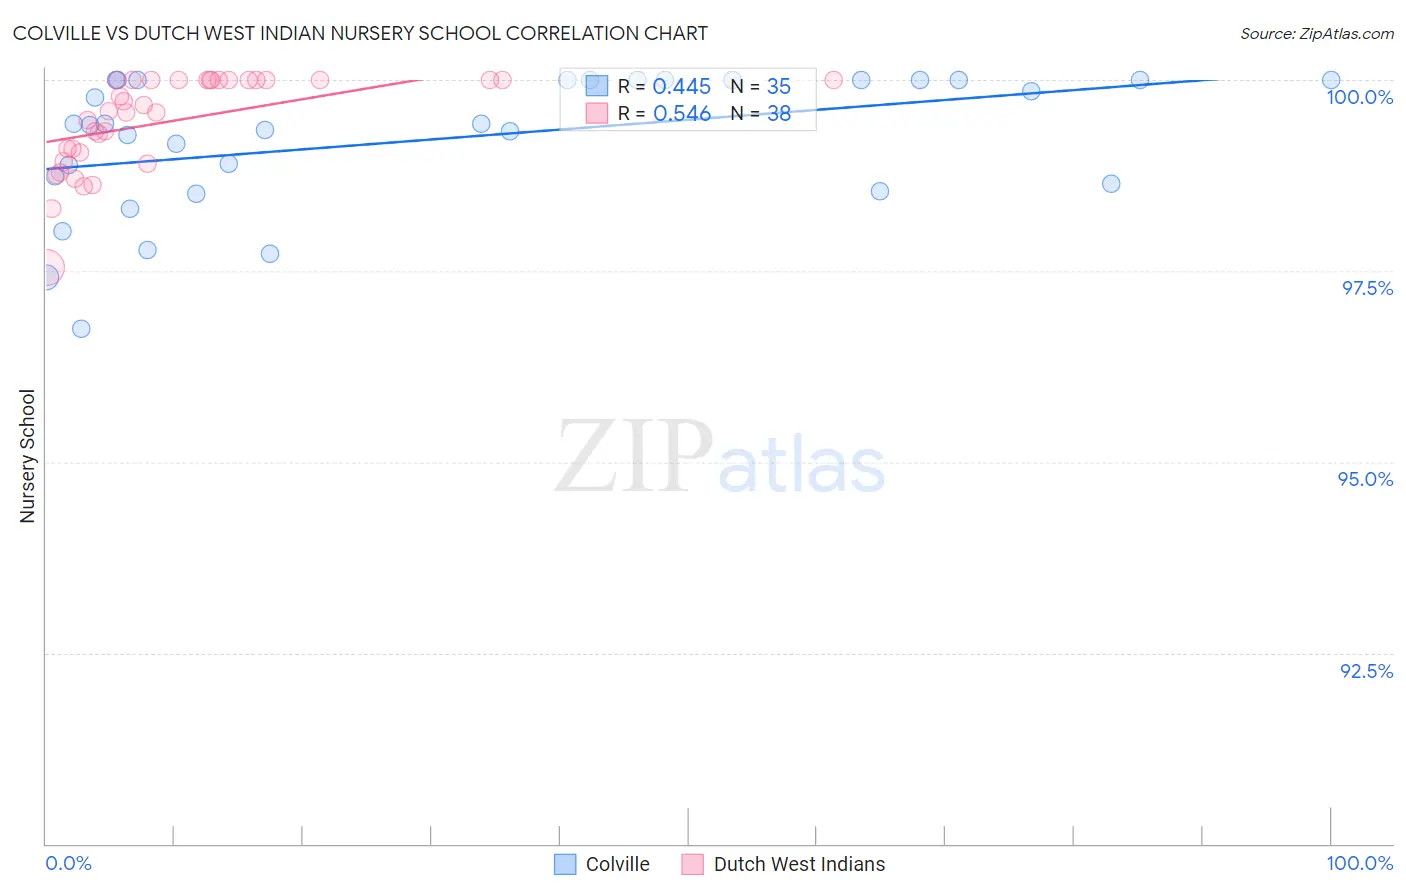
Colville vs Dutch West Indian Nursery School Correlation Chart
The statistical analysis conducted on geographies consisting of 34,687,839 people shows a moderate positive correlation between the proportion of Colville and percentage of population with at least nursery school education in the United States with a correlation coefficient (R) of 0.445 and weighted average of 98.3%. Similarly, the statistical analysis conducted on geographies consisting of 85,776,075 people shows a substantial positive correlation between the proportion of Dutch West Indians and percentage of population with at least nursery school education in the United States with a correlation coefficient (R) of 0.546 and weighted average of 98.0%, a difference of 0.23%.
Nursery School Correlation Summary
| Measurement | Colville | Dutch West Indian |
| Minimum | 96.7% | 97.6% |
| Maximum | 100.0% | 100.0% |
| Range | 3.3% | 2.4% |
| Mean | 99.2% | 99.5% |
| Median | 99.4% | 99.6% |
| Interquartile 25% (IQ1) | 98.6% | 99.0% |
| Interquartile 75% (IQ3) | 100.0% | 100.0% |
| Interquartile Range (IQR) | 1.4% | 0.95% |
| Standard Deviation (Sample) | 0.88% | 0.61% |
| Standard Deviation (Population) | 0.87% | 0.60% |
Similar Demographics by Nursery School
Demographics Similar to Colville by Nursery School
In terms of nursery school, the demographic groups most similar to Colville are Choctaw (98.3%, a difference of 0.0%), Cypriot (98.3%, a difference of 0.010%), Nonimmigrants (98.3%, a difference of 0.010%), Puget Sound Salish (98.3%, a difference of 0.010%), and Romanian (98.3%, a difference of 0.010%).
| Demographics | Rating | Rank | Nursery School |
| Macedonians | 98.7 /100 | #92 | Exceptional 98.3% |
| Immigrants | India | 98.7 /100 | #93 | Exceptional 98.3% |
| Immigrants | Germany | 98.6 /100 | #94 | Exceptional 98.3% |
| South Africans | 98.6 /100 | #95 | Exceptional 98.3% |
| Cypriots | 98.3 /100 | #96 | Exceptional 98.3% |
| Immigrants | Nonimmigrants | 98.3 /100 | #97 | Exceptional 98.3% |
| Choctaw | 98.3 /100 | #98 | Exceptional 98.3% |
| Colville | 98.2 /100 | #99 | Exceptional 98.3% |
| Puget Sound Salish | 98.0 /100 | #100 | Exceptional 98.3% |
| Romanians | 97.9 /100 | #101 | Exceptional 98.3% |
| Immigrants | Ireland | 97.7 /100 | #102 | Exceptional 98.3% |
| Cree | 97.7 /100 | #103 | Exceptional 98.3% |
| Bhutanese | 97.4 /100 | #104 | Exceptional 98.2% |
| Turks | 97.4 /100 | #105 | Exceptional 98.2% |
| Immigrants | Switzerland | 97.3 /100 | #106 | Exceptional 98.2% |
Demographics Similar to Dutch West Indians by Nursery School
In terms of nursery school, the demographic groups most similar to Dutch West Indians are Immigrants from Moldova (98.0%, a difference of 0.0%), Apache (98.1%, a difference of 0.010%), Jordanian (98.1%, a difference of 0.010%), Soviet Union (98.0%, a difference of 0.010%), and Immigrants from Iran (98.0%, a difference of 0.010%).
| Demographics | Rating | Rank | Nursery School |
| Immigrants | Israel | 78.5 /100 | #145 | Good 98.1% |
| Filipinos | 78.5 /100 | #146 | Good 98.1% |
| Hmong | 75.7 /100 | #147 | Good 98.1% |
| Immigrants | Greece | 75.4 /100 | #148 | Good 98.1% |
| Apache | 73.2 /100 | #149 | Good 98.1% |
| Jordanians | 72.9 /100 | #150 | Good 98.1% |
| Soviet Union | 71.6 /100 | #151 | Good 98.0% |
| Dutch West Indians | 70.2 /100 | #152 | Good 98.0% |
| Immigrants | Moldova | 69.6 /100 | #153 | Good 98.0% |
| Immigrants | Iran | 68.7 /100 | #154 | Good 98.0% |
| Immigrants | South Central Asia | 66.7 /100 | #155 | Good 98.0% |
| Venezuelans | 66.6 /100 | #156 | Good 98.0% |
| Comanche | 66.0 /100 | #157 | Good 98.0% |
| Immigrants | North Macedonia | 65.7 /100 | #158 | Good 98.0% |
| French American Indians | 62.1 /100 | #159 | Good 98.0% |