Chippewa vs Immigrants from Canada 3rd Grade
COMPARE
Chippewa
Immigrants from Canada
3rd Grade
3rd Grade Comparison
Chippewa
Immigrants from Canada
98.4%
3RD GRADE
99.9/ 100
METRIC RATING
38th/ 347
METRIC RANK
98.2%
3RD GRADE
99.7/ 100
METRIC RATING
62nd/ 347
METRIC RANK
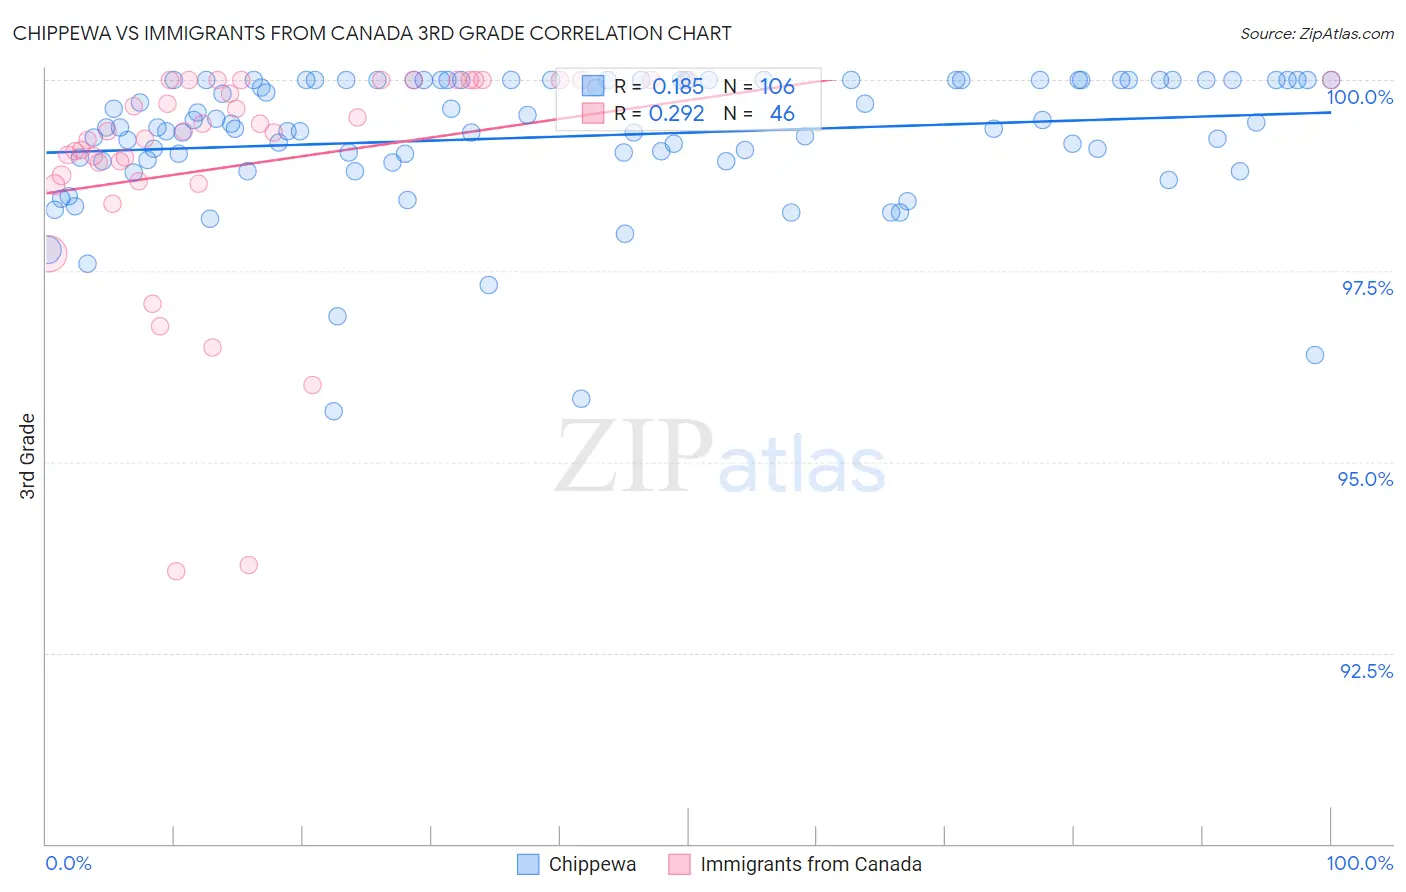
Chippewa vs Immigrants from Canada 3rd Grade Correlation Chart
The statistical analysis conducted on geographies consisting of 215,065,644 people shows a poor positive correlation between the proportion of Chippewa and percentage of population with at least 3rd grade education in the United States with a correlation coefficient (R) of 0.185 and weighted average of 98.4%. Similarly, the statistical analysis conducted on geographies consisting of 459,397,554 people shows a weak positive correlation between the proportion of Immigrants from Canada and percentage of population with at least 3rd grade education in the United States with a correlation coefficient (R) of 0.292 and weighted average of 98.2%, a difference of 0.13%.
3rd Grade Correlation Summary
| Measurement | Chippewa | Immigrants from Canada |
| Minimum | 95.7% | 93.6% |
| Maximum | 100.0% | 100.0% |
| Range | 4.3% | 6.4% |
| Mean | 99.3% | 98.9% |
| Median | 99.4% | 99.3% |
| Interquartile 25% (IQ1) | 98.9% | 98.8% |
| Interquartile 75% (IQ3) | 100.0% | 100.0% |
| Interquartile Range (IQR) | 1.1% | 1.2% |
| Standard Deviation (Sample) | 0.88% | 1.5% |
| Standard Deviation (Population) | 0.88% | 1.5% |
Similar Demographics by 3rd Grade
Demographics Similar to Chippewa by 3rd Grade
In terms of 3rd grade, the demographic groups most similar to Chippewa are British (98.4%, a difference of 0.010%), Italian (98.4%, a difference of 0.010%), Latvian (98.4%, a difference of 0.010%), Arapaho (98.4%, a difference of 0.020%), and Eastern European (98.3%, a difference of 0.020%).
| Demographics | Rating | Rank | 3rd Grade |
| Czechs | 100.0 /100 | #31 | Exceptional 98.4% |
| Scandinavians | 100.0 /100 | #32 | Exceptional 98.4% |
| Chinese | 100.0 /100 | #33 | Exceptional 98.4% |
| Swiss | 100.0 /100 | #34 | Exceptional 98.4% |
| Arapaho | 100.0 /100 | #35 | Exceptional 98.4% |
| British | 99.9 /100 | #36 | Exceptional 98.4% |
| Italians | 99.9 /100 | #37 | Exceptional 98.4% |
| Chippewa | 99.9 /100 | #38 | Exceptional 98.4% |
| Latvians | 99.9 /100 | #39 | Exceptional 98.4% |
| Eastern Europeans | 99.9 /100 | #40 | Exceptional 98.3% |
| Luxembourgers | 99.9 /100 | #41 | Exceptional 98.3% |
| Belgians | 99.9 /100 | #42 | Exceptional 98.3% |
| Northern Europeans | 99.9 /100 | #43 | Exceptional 98.3% |
| Hungarians | 99.9 /100 | #44 | Exceptional 98.3% |
| Native Hawaiians | 99.9 /100 | #45 | Exceptional 98.3% |
Demographics Similar to Immigrants from Canada by 3rd Grade
In terms of 3rd grade, the demographic groups most similar to Immigrants from Canada are Pueblo (98.2%, a difference of 0.0%), Austrian (98.3%, a difference of 0.010%), Slavic (98.3%, a difference of 0.010%), Greek (98.3%, a difference of 0.010%), and Maltese (98.3%, a difference of 0.010%).
| Demographics | Rating | Rank | 3rd Grade |
| Americans | 99.8 /100 | #55 | Exceptional 98.3% |
| Austrians | 99.8 /100 | #56 | Exceptional 98.3% |
| Slavs | 99.7 /100 | #57 | Exceptional 98.3% |
| Greeks | 99.7 /100 | #58 | Exceptional 98.3% |
| Maltese | 99.7 /100 | #59 | Exceptional 98.3% |
| Creek | 99.7 /100 | #60 | Exceptional 98.2% |
| Pueblo | 99.7 /100 | #61 | Exceptional 98.2% |
| Immigrants | Canada | 99.7 /100 | #62 | Exceptional 98.2% |
| Immigrants | North America | 99.7 /100 | #63 | Exceptional 98.2% |
| Kiowa | 99.6 /100 | #64 | Exceptional 98.2% |
| New Zealanders | 99.6 /100 | #65 | Exceptional 98.2% |
| Serbians | 99.6 /100 | #66 | Exceptional 98.2% |
| Russians | 99.6 /100 | #67 | Exceptional 98.2% |
| Immigrants | Northern Europe | 99.6 /100 | #68 | Exceptional 98.2% |
| Canadians | 99.6 /100 | #69 | Exceptional 98.2% |