Chilean vs Yup'ik 3rd Grade
COMPARE
Chilean
Yup'ik
3rd Grade
3rd Grade Comparison
Chileans
Yup'ik
97.8%
3RD GRADE
55.3/ 100
METRIC RATING
167th/ 347
METRIC RANK
99.0%
3RD GRADE
100.0/ 100
METRIC RATING
2nd/ 347
METRIC RANK
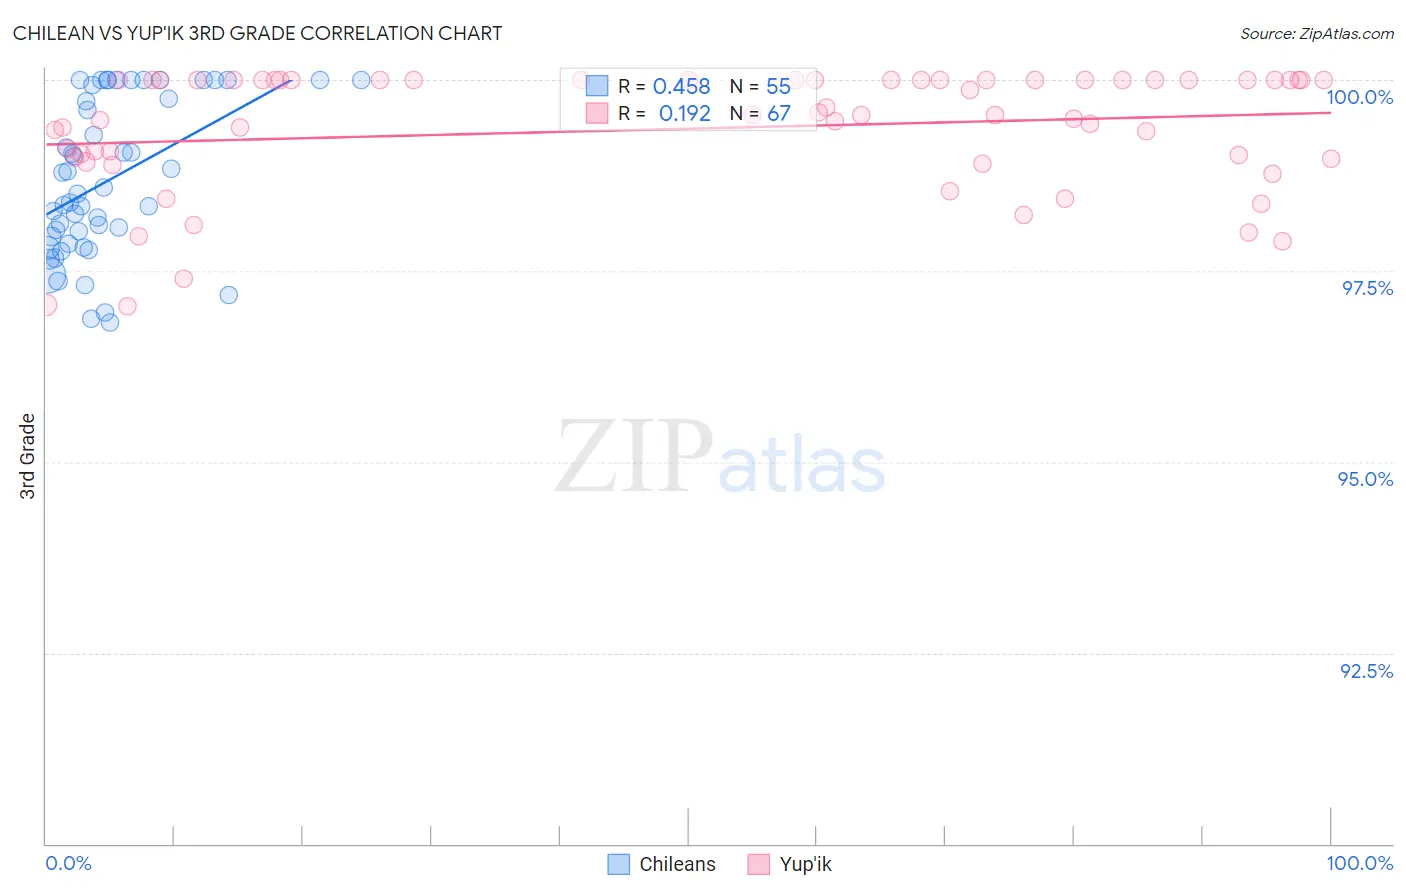
Chilean vs Yup'ik 3rd Grade Correlation Chart
The statistical analysis conducted on geographies consisting of 256,684,337 people shows a moderate positive correlation between the proportion of Chileans and percentage of population with at least 3rd grade education in the United States with a correlation coefficient (R) of 0.458 and weighted average of 97.8%. Similarly, the statistical analysis conducted on geographies consisting of 39,964,464 people shows a poor positive correlation between the proportion of Yup'ik and percentage of population with at least 3rd grade education in the United States with a correlation coefficient (R) of 0.192 and weighted average of 99.0%, a difference of 1.3%.
3rd Grade Correlation Summary
| Measurement | Chilean | Yup'ik |
| Minimum | 96.8% | 97.0% |
| Maximum | 100.0% | 100.0% |
| Range | 3.2% | 3.0% |
| Mean | 98.7% | 99.4% |
| Median | 98.5% | 99.5% |
| Interquartile 25% (IQ1) | 97.9% | 99.0% |
| Interquartile 75% (IQ3) | 99.9% | 100.0% |
| Interquartile Range (IQR) | 2.1% | 1.0% |
| Standard Deviation (Sample) | 1.0% | 0.79% |
| Standard Deviation (Population) | 1.00% | 0.78% |
Similar Demographics by 3rd Grade
Demographics Similar to Chileans by 3rd Grade
In terms of 3rd grade, the demographic groups most similar to Chileans are Immigrants from Bosnia and Herzegovina (97.8%, a difference of 0.0%), Ugandan (97.8%, a difference of 0.0%), Dutch West Indian (97.8%, a difference of 0.0%), Immigrants from Spain (97.8%, a difference of 0.0%), and Immigrants from Iran (97.8%, a difference of 0.010%).
| Demographics | Rating | Rank | 3rd Grade |
| Immigrants | Iran | 59.1 /100 | #160 | Average 97.8% |
| Albanians | 58.8 /100 | #161 | Average 97.8% |
| Immigrants | Jordan | 57.9 /100 | #162 | Average 97.8% |
| Marshallese | 57.2 /100 | #163 | Average 97.8% |
| Immigrants | Bosnia and Herzegovina | 56.2 /100 | #164 | Average 97.8% |
| Ugandans | 56.1 /100 | #165 | Average 97.8% |
| Dutch West Indians | 55.5 /100 | #166 | Average 97.8% |
| Chileans | 55.3 /100 | #167 | Average 97.8% |
| Immigrants | Spain | 54.3 /100 | #168 | Average 97.8% |
| Comanche | 53.8 /100 | #169 | Average 97.8% |
| Brazilians | 53.7 /100 | #170 | Average 97.8% |
| Kenyans | 51.8 /100 | #171 | Average 97.8% |
| Spanish Americans | 51.8 /100 | #172 | Average 97.8% |
| Immigrants | Korea | 50.9 /100 | #173 | Average 97.8% |
| Navajo | 50.0 /100 | #174 | Average 97.8% |
Demographics Similar to Yup'ik by 3rd Grade
In terms of 3rd grade, the demographic groups most similar to Yup'ik are Welsh (98.8%, a difference of 0.23%), Inupiat (98.8%, a difference of 0.26%), Tsimshian (98.8%, a difference of 0.27%), Alaskan Athabascan (98.7%, a difference of 0.36%), and Norwegian (98.6%, a difference of 0.40%).
| Demographics | Rating | Rank | 3rd Grade |
| Crow | 100.0 /100 | #1 | Exceptional 99.6% |
| Yup'ik | 100.0 /100 | #2 | Exceptional 99.0% |
| Welsh | 100.0 /100 | #3 | Exceptional 98.8% |
| Inupiat | 100.0 /100 | #4 | Exceptional 98.8% |
| Tsimshian | 100.0 /100 | #5 | Exceptional 98.8% |
| Alaskan Athabascans | 100.0 /100 | #6 | Exceptional 98.7% |
| Norwegians | 100.0 /100 | #7 | Exceptional 98.6% |
| Slovaks | 100.0 /100 | #8 | Exceptional 98.6% |
| Germans | 100.0 /100 | #9 | Exceptional 98.6% |
| Alaska Natives | 100.0 /100 | #10 | Exceptional 98.6% |
| Slovenes | 100.0 /100 | #11 | Exceptional 98.6% |
| English | 100.0 /100 | #12 | Exceptional 98.6% |
| Tlingit-Haida | 100.0 /100 | #13 | Exceptional 98.5% |
| Carpatho Rusyns | 100.0 /100 | #14 | Exceptional 98.5% |
| Swedes | 100.0 /100 | #15 | Exceptional 98.5% |