Cherokee vs Immigrants from Northern Africa Professional Degree
COMPARE
Cherokee
Immigrants from Northern Africa
Professional Degree
Professional Degree Comparison
Cherokee
Immigrants from Northern Africa
3.3%
PROFESSIONAL DEGREE
0.1/ 100
METRIC RATING
311th/ 347
METRIC RANK
5.1%
PROFESSIONAL DEGREE
98.4/ 100
METRIC RATING
103rd/ 347
METRIC RANK
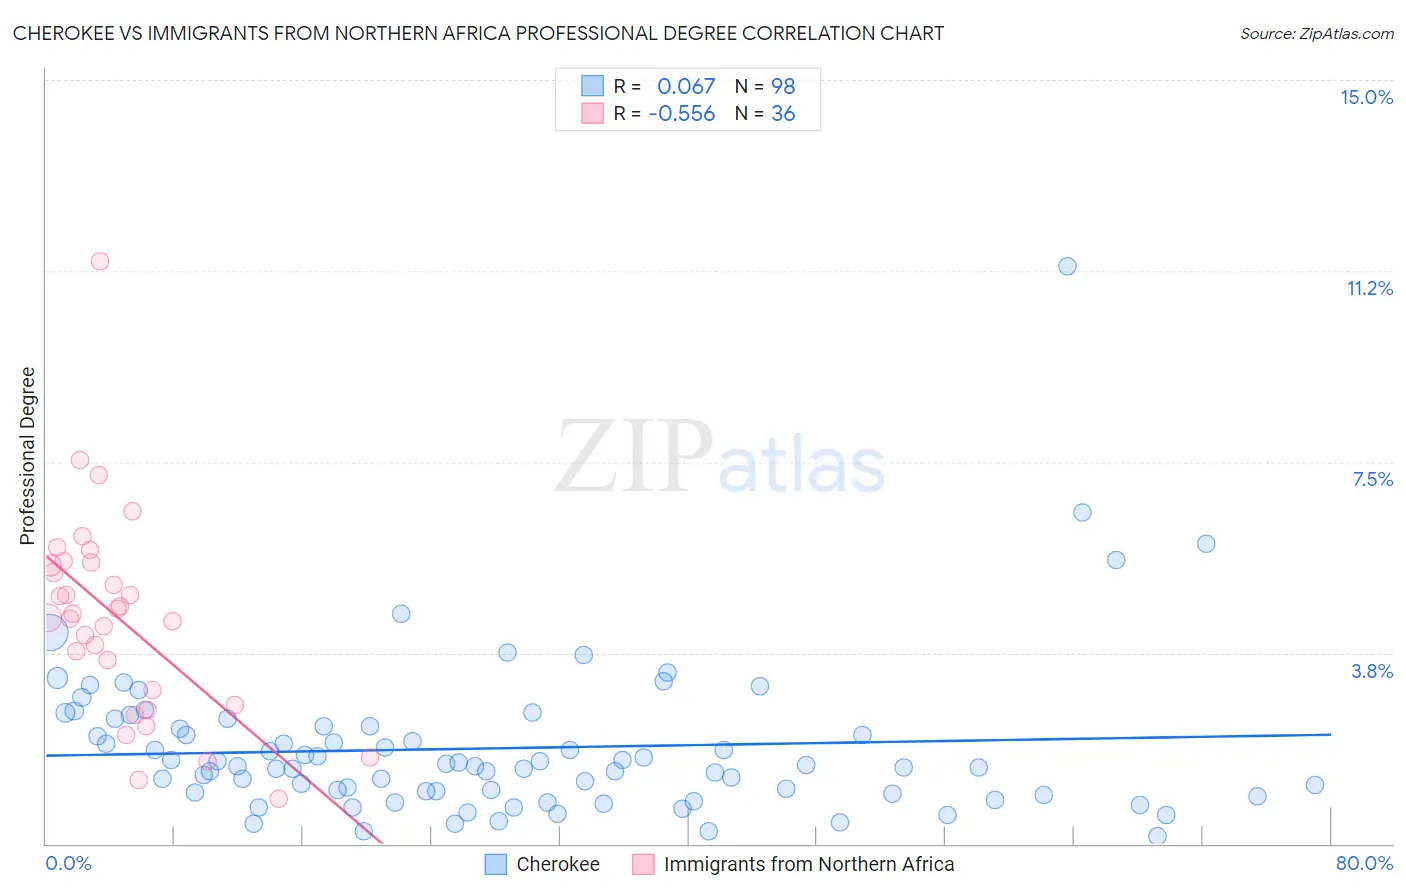
Cherokee vs Immigrants from Northern Africa Professional Degree Correlation Chart
The statistical analysis conducted on geographies consisting of 489,212,297 people shows a slight positive correlation between the proportion of Cherokee and percentage of population with at least professional degree education in the United States with a correlation coefficient (R) of 0.067 and weighted average of 3.3%. Similarly, the statistical analysis conducted on geographies consisting of 320,940,889 people shows a substantial negative correlation between the proportion of Immigrants from Northern Africa and percentage of population with at least professional degree education in the United States with a correlation coefficient (R) of -0.556 and weighted average of 5.1%, a difference of 53.7%.
Professional Degree Correlation Summary
| Measurement | Cherokee | Immigrants from Northern Africa |
| Minimum | 0.14% | 0.89% |
| Maximum | 11.3% | 11.4% |
| Range | 11.2% | 10.5% |
| Mean | 1.9% | 4.4% |
| Median | 1.5% | 4.5% |
| Interquartile 25% (IQ1) | 1.0% | 2.9% |
| Interquartile 75% (IQ3) | 2.3% | 5.5% |
| Interquartile Range (IQR) | 1.3% | 2.6% |
| Standard Deviation (Sample) | 1.5% | 2.0% |
| Standard Deviation (Population) | 1.5% | 2.0% |
Similar Demographics by Professional Degree
Demographics Similar to Cherokee by Professional Degree
In terms of professional degree, the demographic groups most similar to Cherokee are Immigrants from Latin America (3.3%, a difference of 0.15%), Pima (3.3%, a difference of 0.47%), Shoshone (3.3%, a difference of 0.48%), Sioux (3.3%, a difference of 0.59%), and Yuman (3.3%, a difference of 0.60%).
| Demographics | Rating | Rank | Professional Degree |
| Cajuns | 0.2 /100 | #304 | Tragic 3.4% |
| Chickasaw | 0.1 /100 | #305 | Tragic 3.4% |
| Cape Verdeans | 0.1 /100 | #306 | Tragic 3.4% |
| Samoans | 0.1 /100 | #307 | Tragic 3.3% |
| Shoshone | 0.1 /100 | #308 | Tragic 3.3% |
| Pima | 0.1 /100 | #309 | Tragic 3.3% |
| Immigrants | Latin America | 0.1 /100 | #310 | Tragic 3.3% |
| Cherokee | 0.1 /100 | #311 | Tragic 3.3% |
| Sioux | 0.1 /100 | #312 | Tragic 3.3% |
| Yuman | 0.1 /100 | #313 | Tragic 3.3% |
| Mexican American Indians | 0.1 /100 | #314 | Tragic 3.3% |
| Immigrants | Laos | 0.1 /100 | #315 | Tragic 3.2% |
| Puerto Ricans | 0.1 /100 | #316 | Tragic 3.2% |
| Nepalese | 0.1 /100 | #317 | Tragic 3.2% |
| Immigrants | Micronesia | 0.1 /100 | #318 | Tragic 3.2% |
Demographics Similar to Immigrants from Northern Africa by Professional Degree
In terms of professional degree, the demographic groups most similar to Immigrants from Northern Africa are Ukrainian (5.1%, a difference of 0.25%), Arab (5.0%, a difference of 0.31%), Immigrants from Egypt (5.1%, a difference of 0.33%), Immigrants from Uganda (5.0%, a difference of 0.34%), and Immigrants from Ukraine (5.0%, a difference of 0.37%).
| Demographics | Rating | Rank | Professional Degree |
| Immigrants | Uzbekistan | 99.2 /100 | #96 | Exceptional 5.2% |
| Syrians | 99.1 /100 | #97 | Exceptional 5.2% |
| Austrians | 99.1 /100 | #98 | Exceptional 5.2% |
| Immigrants | Italy | 99.1 /100 | #99 | Exceptional 5.2% |
| Ugandans | 98.8 /100 | #100 | Exceptional 5.1% |
| Immigrants | Egypt | 98.5 /100 | #101 | Exceptional 5.1% |
| Ukrainians | 98.5 /100 | #102 | Exceptional 5.1% |
| Immigrants | Northern Africa | 98.4 /100 | #103 | Exceptional 5.1% |
| Arabs | 98.2 /100 | #104 | Exceptional 5.0% |
| Immigrants | Uganda | 98.2 /100 | #105 | Exceptional 5.0% |
| Immigrants | Ukraine | 98.2 /100 | #106 | Exceptional 5.0% |
| Maltese | 98.1 /100 | #107 | Exceptional 5.0% |
| Immigrants | Southern Europe | 98.1 /100 | #108 | Exceptional 5.0% |
| British | 98.0 /100 | #109 | Exceptional 5.0% |
| Lebanese | 98.0 /100 | #110 | Exceptional 5.0% |