Central American vs Arapaho 11th Grade

COMPARE

Central American
Race
Ancestry
AfghanAfricanAlaska NativeAlaskan AthabascanAlbanianAleutAlsatianAmericanApacheArabArgentineanArmenianAssyrian/Chaldean/SyriacAustralianAustrianBahamianBangladeshiBarbadianBasqueBelgianBelizeanBermudanBhutaneseBlackfeetBolivianBrazilianBritishBritish West IndianBulgarianBurmeseCajunCambodianCanadianCape VerdeanCarpatho RusynCelticCentral AmericanCentral American IndianCherokeeCheyenneChickasawChileanChineseChippewaChoctawColombianColvilleComancheCosta RicanCreeCreekCroatianCrowCubanCypriotCzechCzechoslovakianDanishDelawareDominicanDutchDutch West IndianEastern EuropeanEcuadorianEgyptianEnglishEstonianEthiopianEuropeanFijianFilipinoFinnishFrenchFrench American IndianFrench CanadianGermanGerman RussianGhanaianGreekGuamanian/ChamorroGuatemalanGuyaneseHaitianHmongHonduranHopiHoumaHungarianIcelanderIndian (Asian)IndonesianInupiatIranianIraqiIrishIroquoisIsraeliItalianJamaicanJapaneseJordanianKenyanKiowaKoreanLaotianLatvianLebaneseLiberianLithuanianLumbeeLuxembourgerMacedonianMalaysianMalteseMarshalleseMenomineeMexicanMexican American IndianMongolianMoroccanNative HawaiianNavajoNepaleseNew ZealanderNicaraguanNigerianNorthern EuropeanNorwegianOkinawanOsageOttawaPaiutePakistaniPalestinianPanamanianParaguayanPennsylvania GermanPeruvianPimaPolishPortuguesePotawatomiPuebloPuerto RicanPuget Sound SalishRomanianRussianSalvadoranSamoanScandinavianScotch-IrishScottishSeminoleSenegaleseSerbianShoshoneSierra LeoneanSiouxSlavicSlovakSloveneSomaliSouth AfricanSouth AmericanSouth American IndianSoviet UnionSpaniardSpanishSpanish AmericanSpanish American IndianSri LankanSubsaharan AfricanSudaneseSwedishSwissSyrianTaiwaneseThaiTlingit-HaidaTohono O'OdhamTonganTrinidadian and TobagonianTsimshianTurkishU.S. Virgin IslanderUgandanUkrainianUruguayanUteVenezuelanVietnameseWelshWest IndianYakamaYaquiYugoslavianYumanYup'ikZimbabwean
Immigration
NonimmigrantsImmigrantsAfghanistanAfricaAlbaniaArgentinaArmeniaAsiaAustraliaAustriaBahamasBangladeshBarbadosBelarusBelgiumBelizeBoliviaBosnia and HerzegovinaBrazilBulgariaBurma/MyanmarCabo VerdeCambodiaCameroonCanadaCaribbeanCentral AmericaChileChinaColombiaCongoCosta RicaCroatiaCubaCzechoslovakiaDenmarkDominicaDominican RepublicEastern AfricaEastern AsiaEastern EuropeEcuadorEgyptEl SalvadorEnglandEritreaEthiopiaEuropeFijiFranceGermanyGhanaGreeceGrenadaGuatemalaGuyanaHaitiHondurasHong KongHungaryIndiaIndonesiaIranIraqIrelandIsraelItalyJamaicaJapanJordanKazakhstanKenyaKoreaKuwaitLaosLatin AmericaLatviaLebanonLiberiaLithuaniaMalaysiaMexicoMicronesiaMiddle AfricaMoldovaMoroccoNepalNetherlandsNicaraguaNigeriaNorth AmericaNorth MacedoniaNorthern AfricaNorthern EuropeNorwayOceaniaPakistanPanamaPeruPhilippinesPolandPortugalRomaniaRussiaSaudi ArabiaScotlandSenegalSerbiaSierra LeoneSingaporeSomaliaSouth AfricaSouth AmericaSouth Central AsiaSouth Eastern AsiaSouthern EuropeSpainSri LankaSt. Vincent and the GrenadinesSudanSwedenSwitzerlandSyriaTaiwanThailandTrinidad and TobagoTurkeyUgandaUkraineUruguayUzbekistanVenezuelaVietnamWest IndiesWestern AfricaWestern AsiaWestern EuropeYemenZaireZimbabweAzores
Arapaho
Race
Ancestry
AfghanAfricanAlaska NativeAlaskan AthabascanAlbanianAleutAlsatianAmericanApacheArabArapahoArgentineanArmenianAssyrian/Chaldean/SyriacAustralianAustrianBahamianBangladeshiBarbadianBasqueBelgianBelizeanBermudanBhutaneseBlackfeetBolivianBrazilianBritishBritish West IndianBulgarianBurmeseCajunCambodianCanadianCape VerdeanCarpatho RusynCelticCentral American IndianCherokeeCheyenneChickasawChileanChineseChippewaChoctawColombianColvilleComancheCosta RicanCreeCreekCroatianCrowCubanCypriotCzechCzechoslovakianDanishDelawareDominicanDutchDutch West IndianEastern EuropeanEcuadorianEgyptianEnglishEstonianEthiopianEuropeanFijianFilipinoFinnishFrenchFrench American IndianFrench CanadianGermanGerman RussianGhanaianGreekGuamanian/ChamorroGuatemalanGuyaneseHaitianHmongHonduranHopiHoumaHungarianIcelanderIndian (Asian)IndonesianInupiatIranianIraqiIrishIroquoisIsraeliItalianJamaicanJapaneseJordanianKenyanKiowaKoreanLaotianLatvianLebaneseLiberianLithuanianLumbeeLuxembourgerMacedonianMalaysianMalteseMarshalleseMenomineeMexicanMexican American IndianMongolianMoroccanNative HawaiianNavajoNepaleseNew ZealanderNicaraguanNigerianNorthern EuropeanNorwegianOkinawanOsageOttawaPaiutePakistaniPalestinianPanamanianParaguayanPennsylvania GermanPeruvianPimaPolishPortuguesePotawatomiPuebloPuerto RicanPuget Sound SalishRomanianRussianSalvadoranSamoanScandinavianScotch-IrishScottishSeminoleSenegaleseSerbianShoshoneSierra LeoneanSiouxSlavicSlovakSloveneSomaliSouth AfricanSouth AmericanSouth American IndianSoviet UnionSpaniardSpanishSpanish AmericanSpanish American IndianSri LankanSubsaharan AfricanSudaneseSwedishSwissSyrianTaiwaneseThaiTlingit-HaidaTohono O'OdhamTonganTrinidadian and TobagonianTsimshianTurkishU.S. Virgin IslanderUgandanUkrainianUruguayanUteVenezuelanVietnameseWelshWest IndianYakamaYaquiYugoslavianYumanYup'ikZimbabwean
Immigration
NonimmigrantsImmigrantsAfghanistanAfricaAlbaniaArgentinaArmeniaAsiaAustraliaAustriaBahamasBangladeshBarbadosBelarusBelgiumBelizeBoliviaBosnia and HerzegovinaBrazilBulgariaBurma/MyanmarCabo VerdeCambodiaCameroonCanadaCaribbeanCentral AmericaChileChinaColombiaCongoCosta RicaCroatiaCubaCzechoslovakiaDenmarkDominicaDominican RepublicEastern AfricaEastern AsiaEastern EuropeEcuadorEgyptEl SalvadorEnglandEritreaEthiopiaEuropeFijiFranceGermanyGhanaGreeceGrenadaGuatemalaGuyanaHaitiHondurasHong KongHungaryIndiaIndonesiaIranIraqIrelandIsraelItalyJamaicaJapanJordanKazakhstanKenyaKoreaKuwaitLaosLatin AmericaLatviaLebanonLiberiaLithuaniaMalaysiaMexicoMicronesiaMiddle AfricaMoldovaMoroccoNepalNetherlandsNicaraguaNigeriaNorth AmericaNorth MacedoniaNorthern AfricaNorthern EuropeNorwayOceaniaPakistanPanamaPeruPhilippinesPolandPortugalRomaniaRussiaSaudi ArabiaScotlandSenegalSerbiaSierra LeoneSingaporeSomaliaSouth AfricaSouth AmericaSouth Central AsiaSouth Eastern AsiaSouthern EuropeSpainSri LankaSt. Vincent and the GrenadinesSudanSwedenSwitzerlandSyriaTaiwanThailandTrinidad and TobagoTurkeyUgandaUkraineUruguayUzbekistanVenezuelaVietnamWest IndiesWestern AfricaWestern AsiaWestern EuropeYemenZaireZimbabweAzores
11th Grade
Income
Poverty
Unemployment
Labor Participation
Family Structure
Vehicle Availability
Education Level
Disability

11th Grade Comparison

Central Americans

Arapaho

Tragic
Fair
86.9%
11TH GRADE
0.0/ 100
METRIC RATING
335th/ 347
METRIC RANK
92.4%
11TH GRADE
35.1/ 100
METRIC RATING
186th/ 347
METRIC RANK

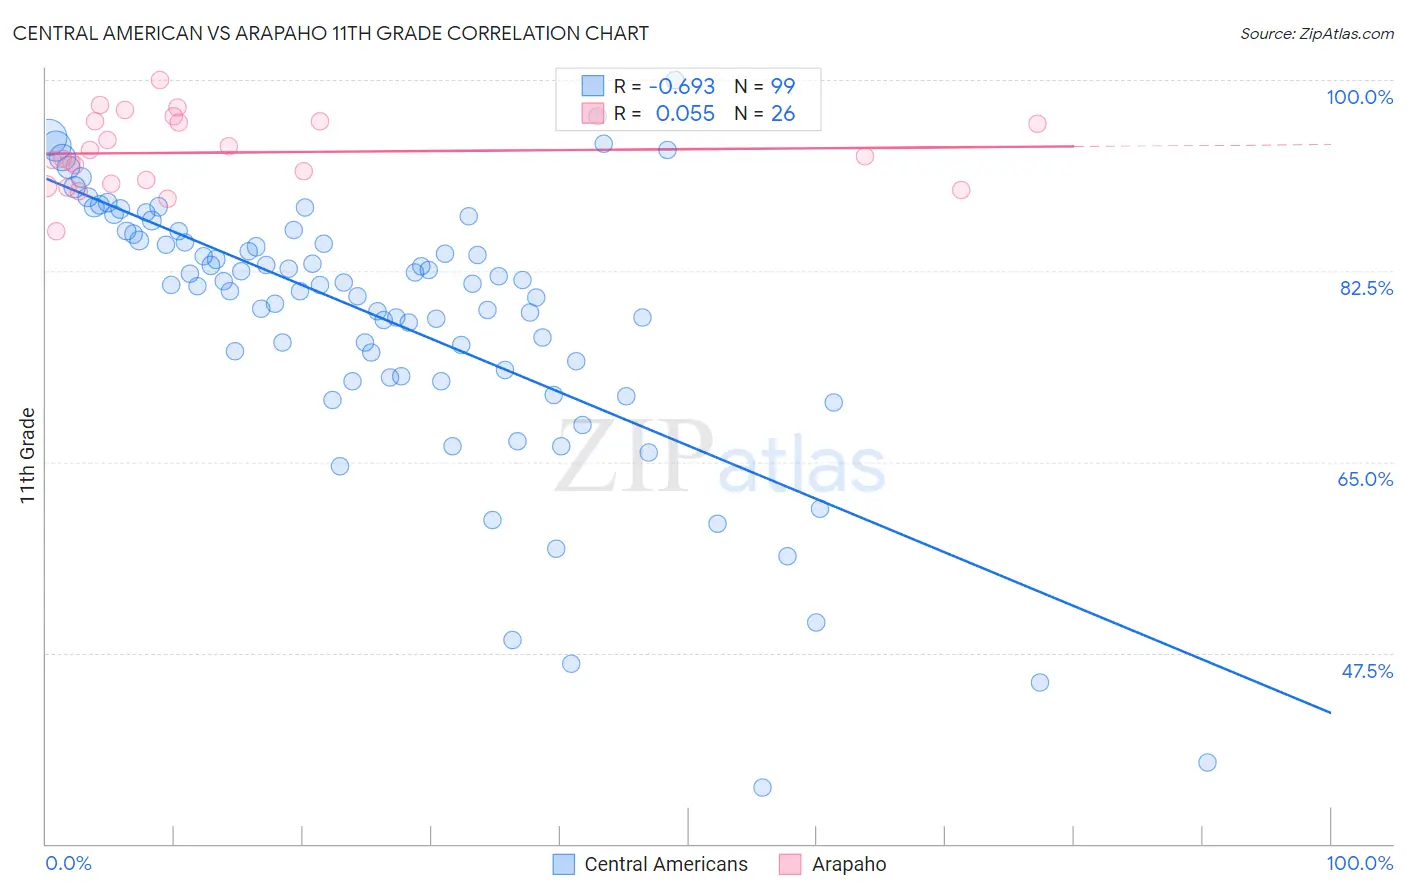
Central American vs Arapaho 11th Grade Correlation Chart

The statistical analysis conducted on geographies consisting of 504,619,347 people shows a significant negative correlation between the proportion of Central Americans and percentage of population with at least 11th grade education in the United States with a correlation coefficient (R) of -0.693 and weighted average of 86.9%. Similarly, the statistical analysis conducted on geographies consisting of 29,780,040 people shows a slight positive correlation between the proportion of Arapaho and percentage of population with at least 11th grade education in the United States with a correlation coefficient (R) of 0.055 and weighted average of 92.4%, a difference of 6.3%.
Central American vs Arapaho 11th Grade

11th Grade Correlation Summary

MeasurementCentral AmericanArapaho
Minimum35.2%86.1%
Maximum100.0%100.0%
Range64.8%13.9%
Mean78.1%93.4%
Median81.3%92.9%
Interquartile 25% (IQ1)72.9%90.5%
Interquartile 75% (IQ3)85.9%96.2%
Interquartile Range (IQR)13.0%5.7%
Standard Deviation (Sample)12.4%3.3%
Standard Deviation (Population)12.3%3.3%

Similar Demographics by 11th Grade

Demographics Similar to Central Americans by 11th Grade

In terms of 11th grade, the demographic groups most similar to Central Americans are Immigrants from Dominican Republic (86.9%, a difference of 0.040%), Immigrants from Honduras (86.9%, a difference of 0.040%), Houma (87.0%, a difference of 0.10%), Immigrants from Yemen (87.1%, a difference of 0.16%), and Immigrants from Latin America (86.8%, a difference of 0.17%).
DemographicsRating | Rank11th Grade
Tohono O'odham
0.0
/100
|
#328
Tragic
87.6%
Mexican American Indians
0.0
/100
|
#329
Tragic
87.5%
Hondurans
0.0
/100
|
#330
Tragic
87.4%
Hispanics or Latinos
0.0
/100
|
#331
Tragic
87.3%
Immigrants | Azores
0.0
/100
|
#332
Tragic
87.2%
Immigrants | Yemen
0.0
/100
|
#333
Tragic
87.1%
Houma
0.0
/100
|
#334
Tragic
87.0%
Central Americans
0.0
/100
|
#335
Tragic
86.9%
Immigrants | Dominican Republic
0.0
/100
|
#336
Tragic
86.9%
Immigrants | Honduras
0.0
/100
|
#337
Tragic
86.9%
Immigrants | Latin America
0.0
/100
|
#338
Tragic
86.8%
Guatemalans
0.0
/100
|
#339
Tragic
86.4%
Salvadorans
0.0
/100
|
#340
Tragic
86.2%
Mexicans
0.0
/100
|
#341
Tragic
86.1%
Immigrants | Guatemala
0.0
/100
|
#342
Tragic
85.8%

Demographics Similar to Arapaho by 11th Grade

In terms of 11th grade, the demographic groups most similar to Arapaho are Immigrants from Western Asia (92.4%, a difference of 0.0%), Immigrants from Nepal (92.4%, a difference of 0.010%), Immigrants from Asia (92.4%, a difference of 0.020%), Immigrants from Indonesia (92.4%, a difference of 0.020%), and Immigrants from Chile (92.4%, a difference of 0.020%).
DemographicsRating | Rank11th Grade
Creek
40.9
/100
|
#179
Average
92.4%
Inupiat
40.7
/100
|
#180
Average
92.4%
Cherokee
40.7
/100
|
#181
Average
92.4%
Immigrants | Morocco
38.6
/100
|
#182
Fair
92.4%
Immigrants | Malaysia
37.6
/100
|
#183
Fair
92.4%
Immigrants | Asia
37.4
/100
|
#184
Fair
92.4%
Immigrants | Nepal
36.4
/100
|
#185
Fair
92.4%
Arapaho
35.1
/100
|
#186
Fair
92.4%
Immigrants | Western Asia
35.0
/100
|
#187
Fair
92.4%
Immigrants | Indonesia
33.7
/100
|
#188
Fair
92.4%
Immigrants | Chile
33.3
/100
|
#189
Fair
92.4%
Chickasaw
31.4
/100
|
#190
Fair
92.3%
French American Indians
30.8
/100
|
#191
Fair
92.3%
Immigrants | Syria
30.4
/100
|
#192
Fair
92.3%
Moroccans
28.7
/100
|
#193
Fair
92.3%