Celtic vs Immigrants from Czechoslovakia Kindergarten
COMPARE
Celtic
Immigrants from Czechoslovakia
Kindergarten
Kindergarten Comparison
Celtics
Immigrants from Czechoslovakia
98.4%
KINDERGARTEN
99.8/ 100
METRIC RATING
53rd/ 347
METRIC RANK
98.2%
KINDERGARTEN
96.6/ 100
METRIC RATING
112th/ 347
METRIC RANK
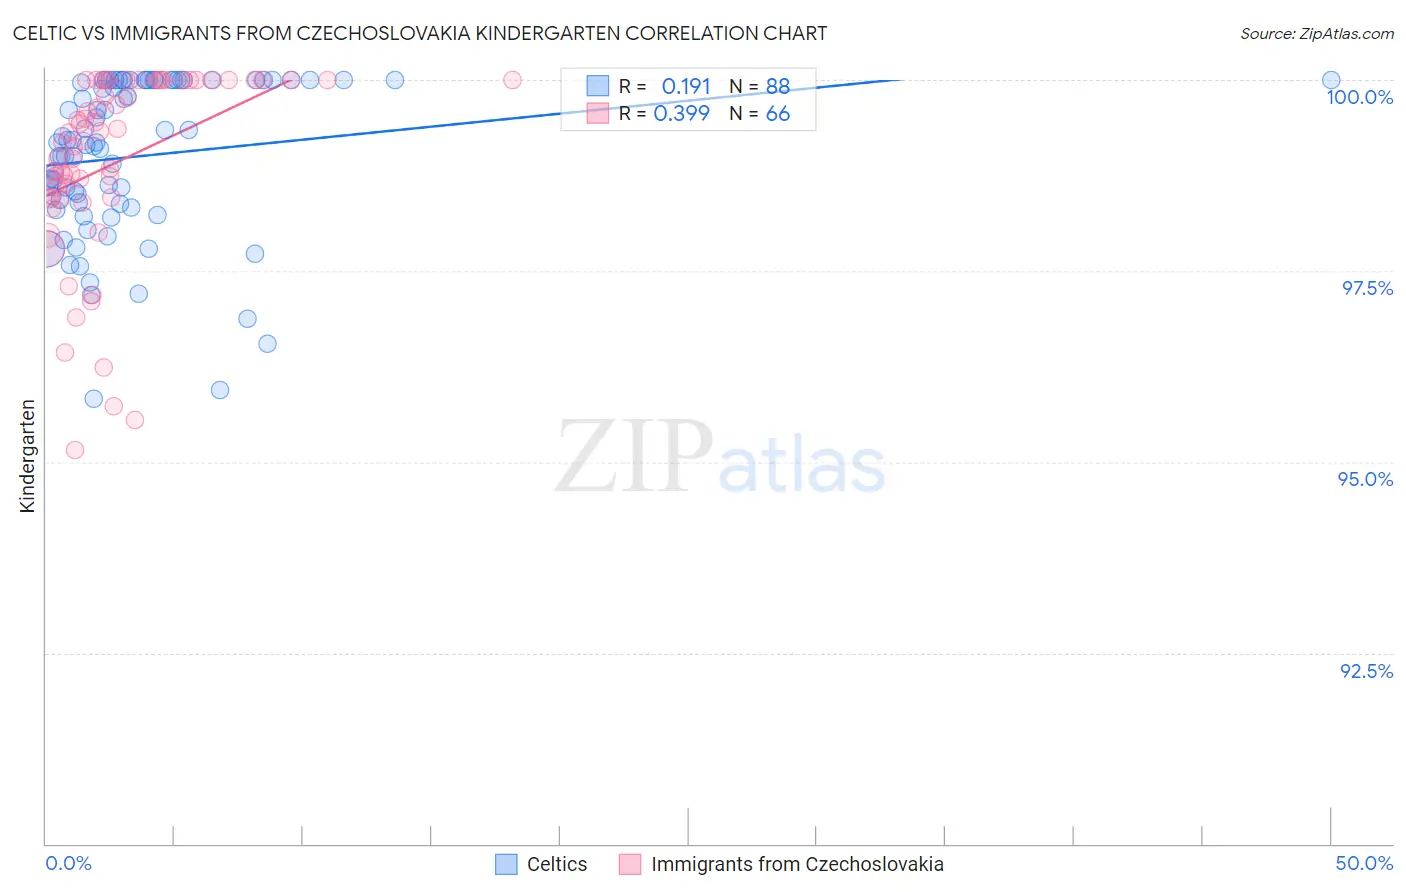
Celtic vs Immigrants from Czechoslovakia Kindergarten Correlation Chart
The statistical analysis conducted on geographies consisting of 168,875,705 people shows a poor positive correlation between the proportion of Celtics and percentage of population with at least kindergarten education in the United States with a correlation coefficient (R) of 0.191 and weighted average of 98.4%. Similarly, the statistical analysis conducted on geographies consisting of 195,448,060 people shows a mild positive correlation between the proportion of Immigrants from Czechoslovakia and percentage of population with at least kindergarten education in the United States with a correlation coefficient (R) of 0.399 and weighted average of 98.2%, a difference of 0.23%.
Kindergarten Correlation Summary
| Measurement | Celtic | Immigrants from Czechoslovakia |
| Minimum | 95.8% | 95.2% |
| Maximum | 100.0% | 100.0% |
| Range | 4.2% | 4.8% |
| Mean | 99.0% | 98.9% |
| Median | 99.2% | 99.3% |
| Interquartile 25% (IQ1) | 98.4% | 98.5% |
| Interquartile 75% (IQ3) | 100.0% | 100.0% |
| Interquartile Range (IQR) | 1.6% | 1.5% |
| Standard Deviation (Sample) | 1.0% | 1.2% |
| Standard Deviation (Population) | 1.0% | 1.2% |
Similar Demographics by Kindergarten
Demographics Similar to Celtics by Kindergarten
In terms of kindergarten, the demographic groups most similar to Celtics are Kiowa (98.4%, a difference of 0.0%), White/Caucasian (98.4%, a difference of 0.0%), Estonian (98.4%, a difference of 0.0%), Australian (98.4%, a difference of 0.0%), and Pueblo (98.4%, a difference of 0.0%).
| Demographics | Rating | Rank | Kindergarten |
| Hungarians | 99.9 /100 | #46 | Exceptional 98.5% |
| Czechoslovakians | 99.8 /100 | #47 | Exceptional 98.4% |
| Ottawa | 99.8 /100 | #48 | Exceptional 98.4% |
| Kiowa | 99.8 /100 | #49 | Exceptional 98.4% |
| Whites/Caucasians | 99.8 /100 | #50 | Exceptional 98.4% |
| Estonians | 99.8 /100 | #51 | Exceptional 98.4% |
| Australians | 99.8 /100 | #52 | Exceptional 98.4% |
| Celtics | 99.8 /100 | #53 | Exceptional 98.4% |
| Pueblo | 99.8 /100 | #54 | Exceptional 98.4% |
| Immigrants | Scotland | 99.8 /100 | #55 | Exceptional 98.4% |
| Americans | 99.8 /100 | #56 | Exceptional 98.4% |
| Austrians | 99.8 /100 | #57 | Exceptional 98.4% |
| Bulgarians | 99.7 /100 | #58 | Exceptional 98.4% |
| Immigrants | Canada | 99.7 /100 | #59 | Exceptional 98.4% |
| Creek | 99.7 /100 | #60 | Exceptional 98.4% |
Demographics Similar to Immigrants from Czechoslovakia by Kindergarten
In terms of kindergarten, the demographic groups most similar to Immigrants from Czechoslovakia are Immigrants from Singapore (98.2%, a difference of 0.0%), Immigrants from Norway (98.2%, a difference of 0.0%), German Russian (98.2%, a difference of 0.010%), Immigrants from Latvia (98.2%, a difference of 0.010%), and Ute (98.2%, a difference of 0.010%).
| Demographics | Rating | Rank | Kindergarten |
| Pima | 97.3 /100 | #105 | Exceptional 98.2% |
| Basques | 97.3 /100 | #106 | Exceptional 98.2% |
| Turks | 97.3 /100 | #107 | Exceptional 98.2% |
| Immigrants | Switzerland | 97.2 /100 | #108 | Exceptional 98.2% |
| German Russians | 97.1 /100 | #109 | Exceptional 98.2% |
| Immigrants | Singapore | 96.8 /100 | #110 | Exceptional 98.2% |
| Immigrants | Norway | 96.6 /100 | #111 | Exceptional 98.2% |
| Immigrants | Czechoslovakia | 96.6 /100 | #112 | Exceptional 98.2% |
| Immigrants | Latvia | 96.3 /100 | #113 | Exceptional 98.2% |
| Ute | 96.3 /100 | #114 | Exceptional 98.2% |
| Iranians | 96.2 /100 | #115 | Exceptional 98.2% |
| Spanish | 95.8 /100 | #116 | Exceptional 98.2% |
| Immigrants | France | 95.5 /100 | #117 | Exceptional 98.2% |
| Yugoslavians | 95.5 /100 | #118 | Exceptional 98.2% |
| Thais | 94.8 /100 | #119 | Exceptional 98.2% |