Canadian vs Immigrants from Ukraine 3rd Grade
COMPARE
Canadian
Immigrants from Ukraine
3rd Grade
3rd Grade Comparison
Canadians
Immigrants from Ukraine
98.2%
3RD GRADE
99.6/ 100
METRIC RATING
69th/ 347
METRIC RANK
97.7%
3RD GRADE
22.7/ 100
METRIC RATING
199th/ 347
METRIC RANK
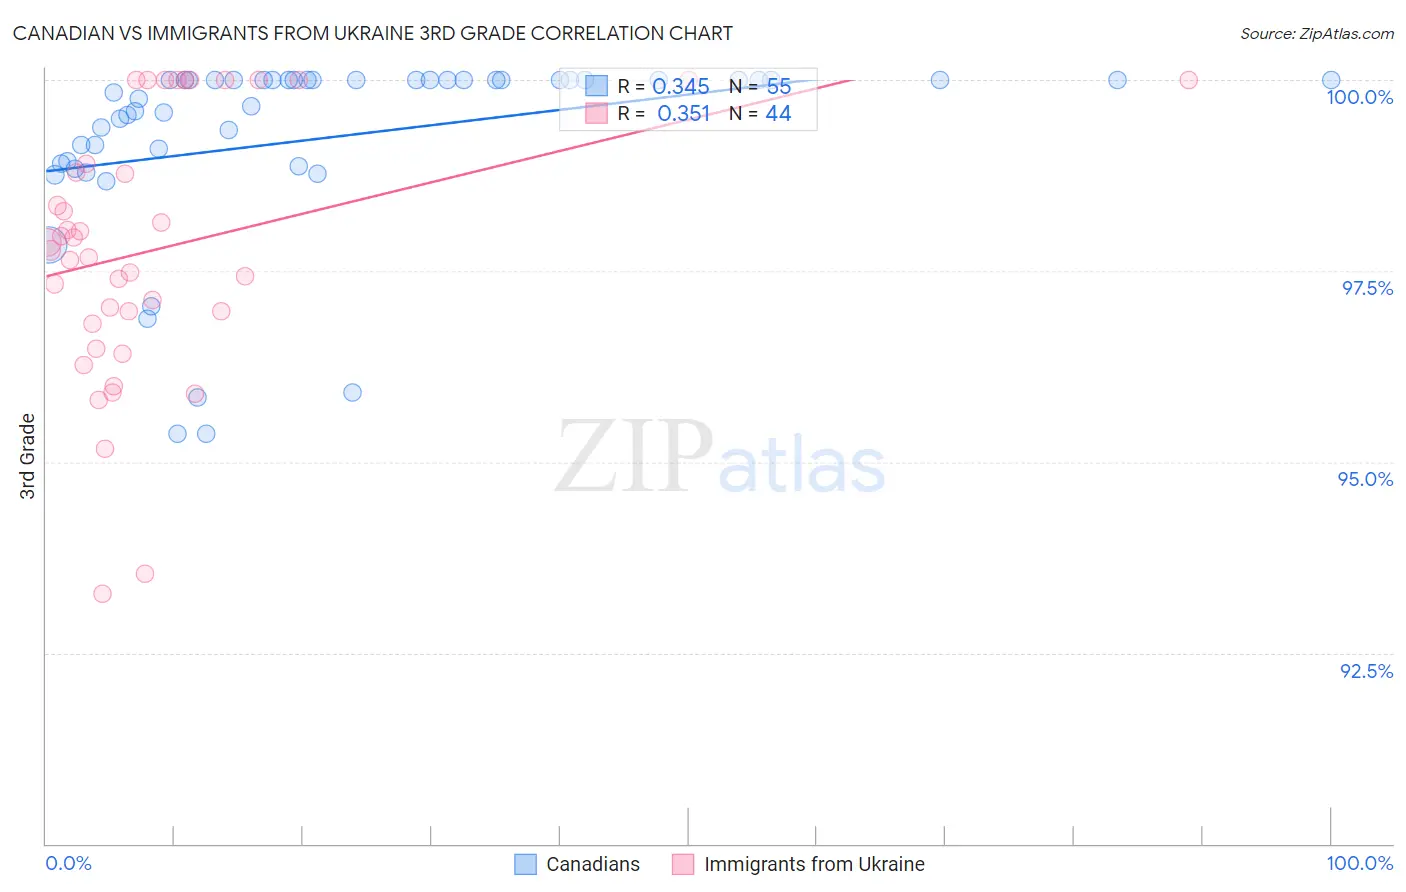
Canadian vs Immigrants from Ukraine 3rd Grade Correlation Chart
The statistical analysis conducted on geographies consisting of 437,557,033 people shows a mild positive correlation between the proportion of Canadians and percentage of population with at least 3rd grade education in the United States with a correlation coefficient (R) of 0.345 and weighted average of 98.2%. Similarly, the statistical analysis conducted on geographies consisting of 289,712,791 people shows a mild positive correlation between the proportion of Immigrants from Ukraine and percentage of population with at least 3rd grade education in the United States with a correlation coefficient (R) of 0.351 and weighted average of 97.7%, a difference of 0.57%.
3rd Grade Correlation Summary
| Measurement | Canadian | Immigrants from Ukraine |
| Minimum | 95.4% | 93.3% |
| Maximum | 100.0% | 100.0% |
| Range | 4.6% | 6.7% |
| Mean | 99.2% | 97.8% |
| Median | 100.0% | 97.8% |
| Interquartile 25% (IQ1) | 98.9% | 96.9% |
| Interquartile 75% (IQ3) | 100.0% | 99.4% |
| Interquartile Range (IQR) | 1.1% | 2.6% |
| Standard Deviation (Sample) | 1.2% | 1.7% |
| Standard Deviation (Population) | 1.2% | 1.7% |
Similar Demographics by 3rd Grade
Demographics Similar to Canadians by 3rd Grade
In terms of 3rd grade, the demographic groups most similar to Canadians are New Zealander (98.2%, a difference of 0.0%), Serbian (98.2%, a difference of 0.0%), Russian (98.2%, a difference of 0.0%), Immigrants from Northern Europe (98.2%, a difference of 0.0%), and Cajun (98.2%, a difference of 0.0%).
| Demographics | Rating | Rank | 3rd Grade |
| Immigrants | Canada | 99.7 /100 | #62 | Exceptional 98.2% |
| Immigrants | North America | 99.7 /100 | #63 | Exceptional 98.2% |
| Kiowa | 99.6 /100 | #64 | Exceptional 98.2% |
| New Zealanders | 99.6 /100 | #65 | Exceptional 98.2% |
| Serbians | 99.6 /100 | #66 | Exceptional 98.2% |
| Russians | 99.6 /100 | #67 | Exceptional 98.2% |
| Immigrants | Northern Europe | 99.6 /100 | #68 | Exceptional 98.2% |
| Canadians | 99.6 /100 | #69 | Exceptional 98.2% |
| Cajuns | 99.6 /100 | #70 | Exceptional 98.2% |
| Immigrants | Austria | 99.6 /100 | #71 | Exceptional 98.2% |
| Chickasaw | 99.5 /100 | #72 | Exceptional 98.2% |
| Cheyenne | 99.3 /100 | #73 | Exceptional 98.2% |
| Immigrants | Netherlands | 99.3 /100 | #74 | Exceptional 98.2% |
| Cherokee | 99.3 /100 | #75 | Exceptional 98.2% |
| Immigrants | England | 99.2 /100 | #76 | Exceptional 98.2% |
Demographics Similar to Immigrants from Ukraine by 3rd Grade
In terms of 3rd grade, the demographic groups most similar to Immigrants from Ukraine are Guamanian/Chamorro (97.7%, a difference of 0.0%), Immigrants from Albania (97.7%, a difference of 0.0%), Hawaiian (97.7%, a difference of 0.010%), Immigrants from Lebanon (97.7%, a difference of 0.010%), and Immigrants from Kenya (97.7%, a difference of 0.020%).
| Demographics | Rating | Rank | 3rd Grade |
| Mongolians | 29.1 /100 | #192 | Fair 97.7% |
| Immigrants | Kenya | 28.2 /100 | #193 | Fair 97.7% |
| Immigrants | Uganda | 27.4 /100 | #194 | Fair 97.7% |
| Immigrants | Egypt | 26.8 /100 | #195 | Fair 97.7% |
| Paraguayans | 26.2 /100 | #196 | Fair 97.7% |
| Hawaiians | 25.7 /100 | #197 | Fair 97.7% |
| Guamanians/Chamorros | 23.6 /100 | #198 | Fair 97.7% |
| Immigrants | Ukraine | 22.7 /100 | #199 | Fair 97.7% |
| Immigrants | Albania | 22.6 /100 | #200 | Fair 97.7% |
| Immigrants | Lebanon | 21.7 /100 | #201 | Fair 97.7% |
| Immigrants | Southern Europe | 17.7 /100 | #202 | Poor 97.6% |
| Paiute | 16.7 /100 | #203 | Poor 97.6% |
| Immigrants | Chile | 16.5 /100 | #204 | Poor 97.6% |
| Africans | 14.5 /100 | #205 | Poor 97.6% |
| Immigrants | Northern Africa | 13.0 /100 | #206 | Poor 97.6% |