Bolivian vs Costa Rican 6th Grade
COMPARE
Bolivian
Costa Rican
6th Grade
6th Grade Comparison
Bolivians
Costa Ricans
96.5%
6TH GRADE
1.0/ 100
METRIC RATING
247th/ 347
METRIC RANK
96.8%
6TH GRADE
6.8/ 100
METRIC RATING
219th/ 347
METRIC RANK
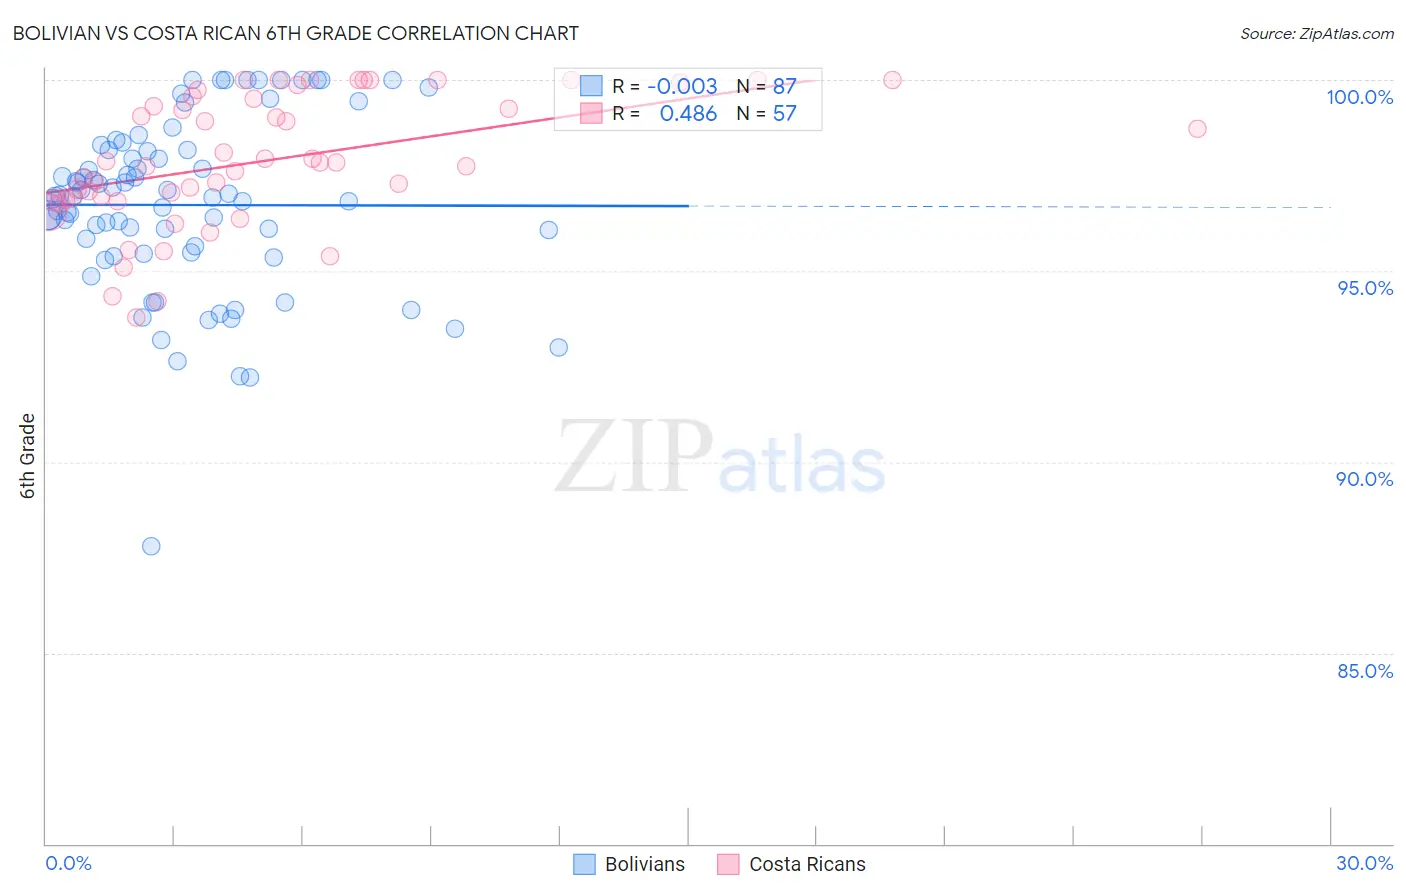
Bolivian vs Costa Rican 6th Grade Correlation Chart
The statistical analysis conducted on geographies consisting of 184,666,822 people shows no correlation between the proportion of Bolivians and percentage of population with at least 6th grade education in the United States with a correlation coefficient (R) of -0.003 and weighted average of 96.5%. Similarly, the statistical analysis conducted on geographies consisting of 253,599,979 people shows a moderate positive correlation between the proportion of Costa Ricans and percentage of population with at least 6th grade education in the United States with a correlation coefficient (R) of 0.486 and weighted average of 96.8%, a difference of 0.23%.
6th Grade Correlation Summary
| Measurement | Bolivian | Costa Rican |
| Minimum | 87.8% | 93.8% |
| Maximum | 100.0% | 100.0% |
| Range | 12.2% | 6.2% |
| Mean | 96.7% | 97.9% |
| Median | 96.9% | 97.9% |
| Interquartile 25% (IQ1) | 95.5% | 96.9% |
| Interquartile 75% (IQ3) | 98.2% | 99.5% |
| Interquartile Range (IQR) | 2.7% | 2.7% |
| Standard Deviation (Sample) | 2.3% | 1.7% |
| Standard Deviation (Population) | 2.2% | 1.7% |
Similar Demographics by 6th Grade
Demographics Similar to Bolivians by 6th Grade
In terms of 6th grade, the demographic groups most similar to Bolivians are Tohono O'odham (96.5%, a difference of 0.0%), Colombian (96.5%, a difference of 0.010%), Immigrants from Costa Rica (96.6%, a difference of 0.030%), Immigrants from Africa (96.6%, a difference of 0.030%), and Immigrants from Middle Africa (96.5%, a difference of 0.030%).
| Demographics | Rating | Rank | 6th Grade |
| Koreans | 1.9 /100 | #240 | Tragic 96.6% |
| Senegalese | 1.8 /100 | #241 | Tragic 96.6% |
| Immigrants | Asia | 1.8 /100 | #242 | Tragic 96.6% |
| Immigrants | Liberia | 1.6 /100 | #243 | Tragic 96.6% |
| Ethiopians | 1.5 /100 | #244 | Tragic 96.6% |
| Immigrants | Costa Rica | 1.3 /100 | #245 | Tragic 96.6% |
| Immigrants | Africa | 1.3 /100 | #246 | Tragic 96.6% |
| Bolivians | 1.0 /100 | #247 | Tragic 96.5% |
| Tohono O'odham | 1.0 /100 | #248 | Tragic 96.5% |
| Colombians | 0.9 /100 | #249 | Tragic 96.5% |
| Immigrants | Middle Africa | 0.8 /100 | #250 | Tragic 96.5% |
| Immigrants | Senegal | 0.7 /100 | #251 | Tragic 96.5% |
| Immigrants | Uruguay | 0.6 /100 | #252 | Tragic 96.5% |
| Jamaicans | 0.6 /100 | #253 | Tragic 96.5% |
| Immigrants | Ethiopia | 0.6 /100 | #254 | Tragic 96.5% |
Demographics Similar to Costa Ricans by 6th Grade
In terms of 6th grade, the demographic groups most similar to Costa Ricans are Liberian (96.8%, a difference of 0.010%), Navajo (96.8%, a difference of 0.010%), Immigrants from Morocco (96.7%, a difference of 0.010%), Tongan (96.7%, a difference of 0.010%), and Portuguese (96.8%, a difference of 0.020%).
| Demographics | Rating | Rank | 6th Grade |
| Moroccans | 9.0 /100 | #212 | Tragic 96.8% |
| Immigrants | Sudan | 8.7 /100 | #213 | Tragic 96.8% |
| Portuguese | 8.2 /100 | #214 | Tragic 96.8% |
| Sierra Leoneans | 8.0 /100 | #215 | Tragic 96.8% |
| Paiute | 7.8 /100 | #216 | Tragic 96.8% |
| Liberians | 7.5 /100 | #217 | Tragic 96.8% |
| Navajo | 7.3 /100 | #218 | Tragic 96.8% |
| Costa Ricans | 6.8 /100 | #219 | Tragic 96.8% |
| Immigrants | Morocco | 6.2 /100 | #220 | Tragic 96.7% |
| Tongans | 6.1 /100 | #221 | Tragic 96.7% |
| Immigrants | Syria | 5.9 /100 | #222 | Tragic 96.7% |
| Bahamians | 4.8 /100 | #223 | Tragic 96.7% |
| Immigrants | Southern Europe | 4.4 /100 | #224 | Tragic 96.7% |
| Immigrants | Pakistan | 4.4 /100 | #225 | Tragic 96.7% |
| Immigrants | Panama | 4.2 /100 | #226 | Tragic 96.7% |