Bermudan vs Central American Indian 1st Grade
COMPARE
Bermudan
Central American Indian
1st Grade
1st Grade Comparison
Bermudans
Central American Indians
97.9%
1ST GRADE
56.3/ 100
METRIC RATING
167th/ 347
METRIC RANK
97.1%
1ST GRADE
0.0/ 100
METRIC RATING
297th/ 347
METRIC RANK
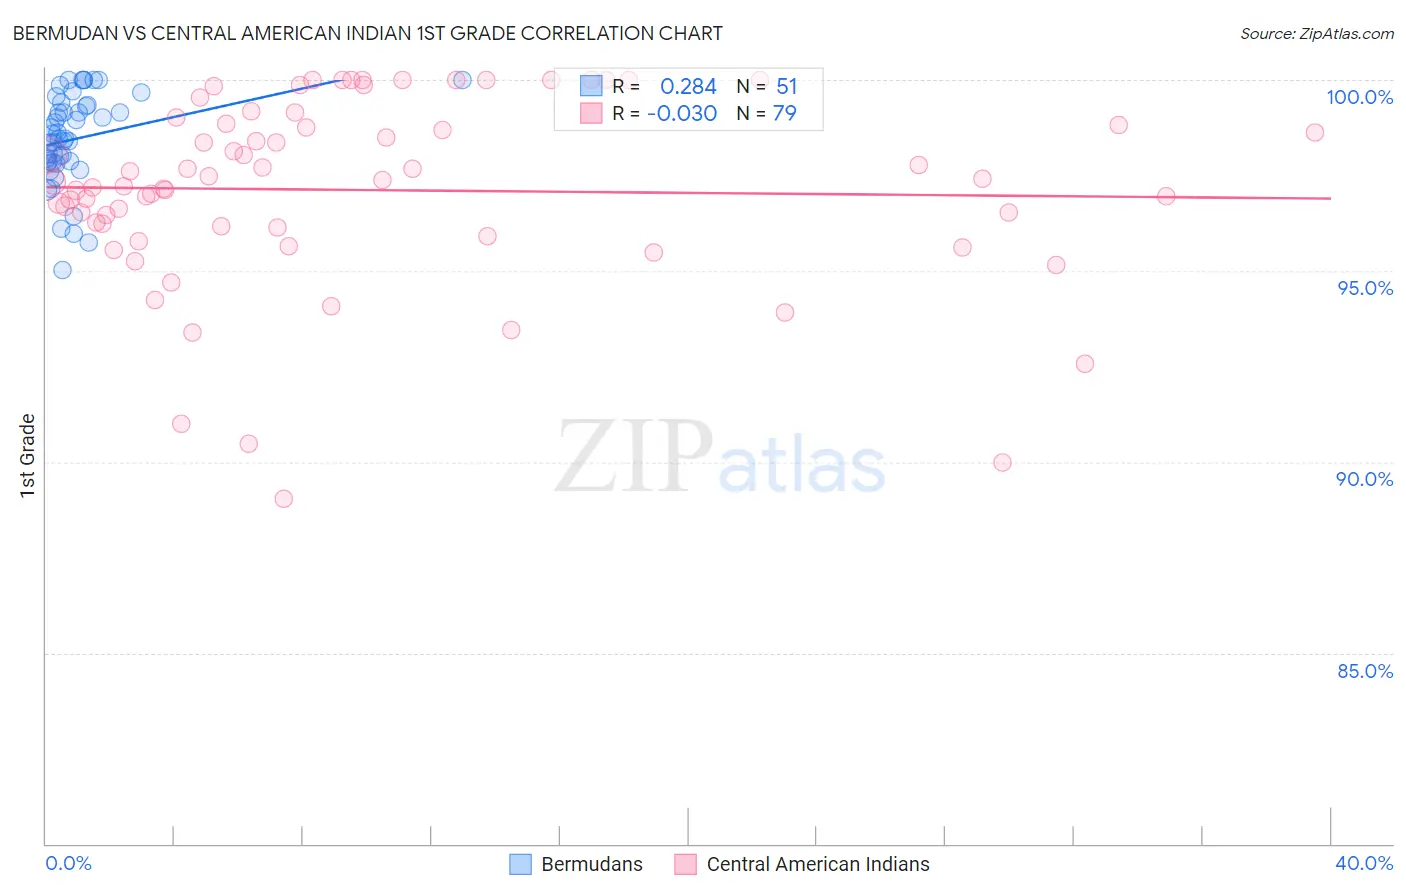
Bermudan vs Central American Indian 1st Grade Correlation Chart
The statistical analysis conducted on geographies consisting of 55,721,975 people shows a weak positive correlation between the proportion of Bermudans and percentage of population with at least 1st grade education in the United States with a correlation coefficient (R) of 0.284 and weighted average of 97.9%. Similarly, the statistical analysis conducted on geographies consisting of 326,141,567 people shows no correlation between the proportion of Central American Indians and percentage of population with at least 1st grade education in the United States with a correlation coefficient (R) of -0.030 and weighted average of 97.1%, a difference of 0.84%.
1st Grade Correlation Summary
| Measurement | Bermudan | Central American Indian |
| Minimum | 95.0% | 89.0% |
| Maximum | 100.0% | 100.0% |
| Range | 5.0% | 11.0% |
| Mean | 98.5% | 97.1% |
| Median | 98.5% | 97.3% |
| Interquartile 25% (IQ1) | 97.8% | 96.2% |
| Interquartile 75% (IQ3) | 99.3% | 98.9% |
| Interquartile Range (IQR) | 1.5% | 2.7% |
| Standard Deviation (Sample) | 1.2% | 2.5% |
| Standard Deviation (Population) | 1.2% | 2.4% |
Similar Demographics by 1st Grade
Demographics Similar to Bermudans by 1st Grade
In terms of 1st grade, the demographic groups most similar to Bermudans are Spanish American (97.9%, a difference of 0.0%), Brazilian (97.9%, a difference of 0.0%), Ugandan (97.9%, a difference of 0.0%), Navajo (97.9%, a difference of 0.0%), and Chilean (97.9%, a difference of 0.0%).
| Demographics | Rating | Rank | 1st Grade |
| Immigrants | Russia | 59.2 /100 | #160 | Average 97.9% |
| Immigrants | Italy | 59.1 /100 | #161 | Average 97.9% |
| Immigrants | Eastern Europe | 58.9 /100 | #162 | Average 97.9% |
| Spanish Americans | 57.7 /100 | #163 | Average 97.9% |
| Brazilians | 57.6 /100 | #164 | Average 97.9% |
| Ugandans | 56.9 /100 | #165 | Average 97.9% |
| Navajo | 56.6 /100 | #166 | Average 97.9% |
| Bermudans | 56.3 /100 | #167 | Average 97.9% |
| Chileans | 55.6 /100 | #168 | Average 97.9% |
| Immigrants | Micronesia | 55.3 /100 | #169 | Average 97.9% |
| Immigrants | Spain | 54.9 /100 | #170 | Average 97.9% |
| Immigrants | Jordan | 53.9 /100 | #171 | Average 97.9% |
| Immigrants | Korea | 53.0 /100 | #172 | Average 97.9% |
| Kenyans | 51.2 /100 | #173 | Average 97.9% |
| Natives/Alaskans | 50.0 /100 | #174 | Average 97.9% |
Demographics Similar to Central American Indians by 1st Grade
In terms of 1st grade, the demographic groups most similar to Central American Indians are Immigrants from Dominica (97.1%, a difference of 0.020%), Immigrants from Cuba (97.1%, a difference of 0.020%), Haitian (97.1%, a difference of 0.030%), Immigrants (97.2%, a difference of 0.050%), and Immigrants from Eritrea (97.2%, a difference of 0.050%).
| Demographics | Rating | Rank | 1st Grade |
| Immigrants | St. Vincent and the Grenadines | 0.0 /100 | #290 | Tragic 97.3% |
| Houma | 0.0 /100 | #291 | Tragic 97.2% |
| British West Indians | 0.0 /100 | #292 | Tragic 97.2% |
| Malaysians | 0.0 /100 | #293 | Tragic 97.2% |
| Immigrants | Grenada | 0.0 /100 | #294 | Tragic 97.2% |
| Immigrants | Immigrants | 0.0 /100 | #295 | Tragic 97.2% |
| Immigrants | Eritrea | 0.0 /100 | #296 | Tragic 97.2% |
| Central American Indians | 0.0 /100 | #297 | Tragic 97.1% |
| Immigrants | Dominica | 0.0 /100 | #298 | Tragic 97.1% |
| Immigrants | Cuba | 0.0 /100 | #299 | Tragic 97.1% |
| Haitians | 0.0 /100 | #300 | Tragic 97.1% |
| Immigrants | South Eastern Asia | 0.0 /100 | #301 | Tragic 97.1% |
| Immigrants | Caribbean | 0.0 /100 | #302 | Tragic 97.0% |
| Somalis | 0.0 /100 | #303 | Tragic 97.0% |
| Nicaraguans | 0.0 /100 | #304 | Tragic 97.0% |