Austrian vs Nigerian High School Diploma
COMPARE
Austrian
Nigerian
High School Diploma
High School Diploma Comparison
Austrians
Nigerians
91.0%
HIGH SCHOOL DIPLOMA
99.6/ 100
METRIC RATING
62nd/ 347
METRIC RANK
88.2%
HIGH SCHOOL DIPLOMA
5.2/ 100
METRIC RATING
229th/ 347
METRIC RANK
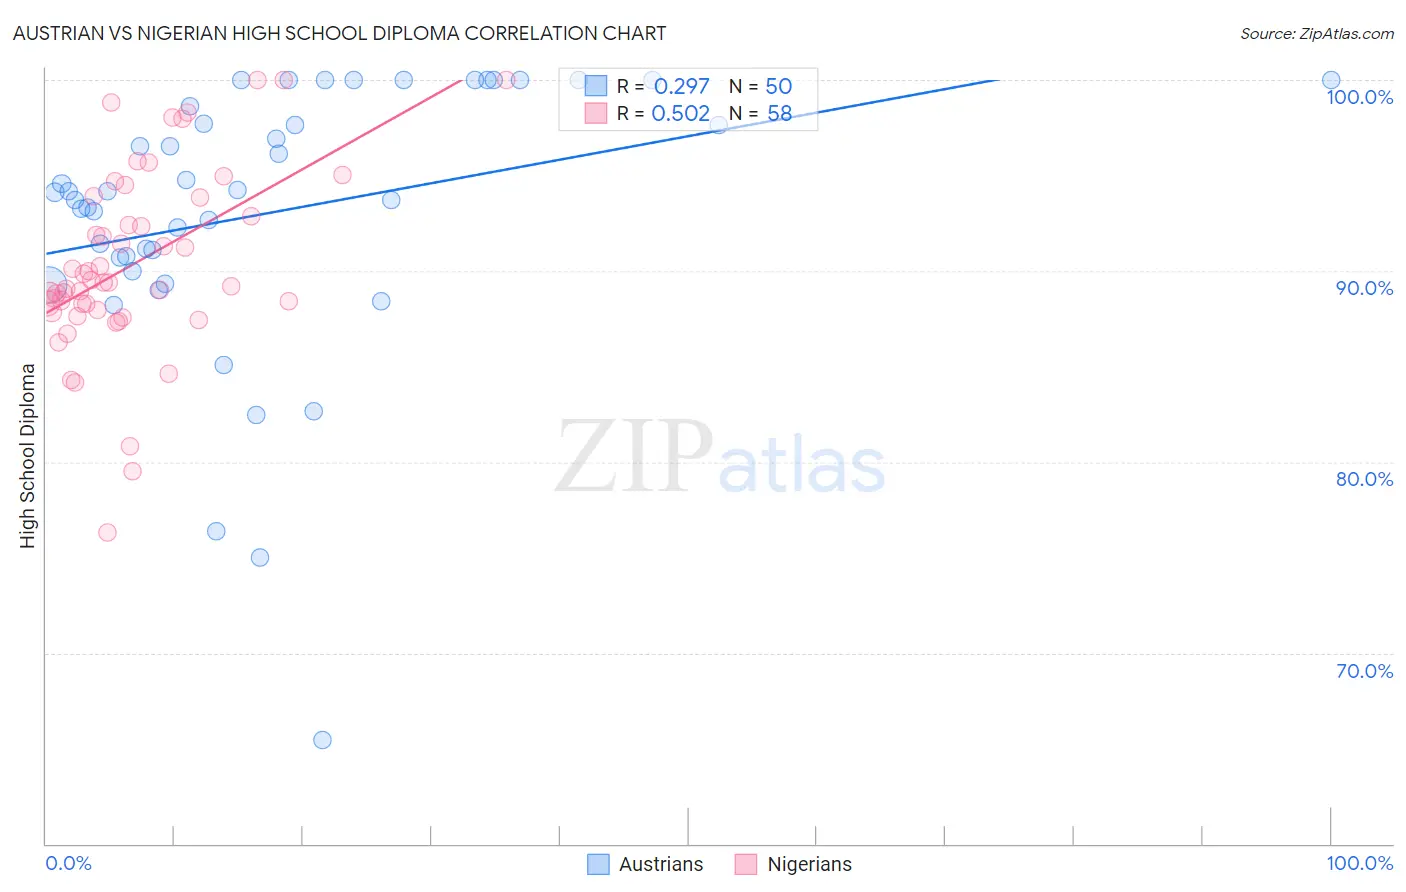
Austrian vs Nigerian High School Diploma Correlation Chart
The statistical analysis conducted on geographies consisting of 452,082,614 people shows a weak positive correlation between the proportion of Austrians and percentage of population with at least high school diploma education in the United States with a correlation coefficient (R) of 0.297 and weighted average of 91.0%. Similarly, the statistical analysis conducted on geographies consisting of 332,724,627 people shows a substantial positive correlation between the proportion of Nigerians and percentage of population with at least high school diploma education in the United States with a correlation coefficient (R) of 0.502 and weighted average of 88.2%, a difference of 3.2%.
High School Diploma Correlation Summary
| Measurement | Austrian | Nigerian |
| Minimum | 65.4% | 76.3% |
| Maximum | 100.0% | 100.0% |
| Range | 34.6% | 23.7% |
| Mean | 93.0% | 90.4% |
| Median | 94.1% | 89.4% |
| Interquartile 25% (IQ1) | 90.7% | 88.0% |
| Interquartile 75% (IQ3) | 98.6% | 93.9% |
| Interquartile Range (IQR) | 7.9% | 5.9% |
| Standard Deviation (Sample) | 7.2% | 4.9% |
| Standard Deviation (Population) | 7.1% | 4.8% |
Similar Demographics by High School Diploma
Demographics Similar to Austrians by High School Diploma
In terms of high school diploma, the demographic groups most similar to Austrians are Immigrants from Taiwan (91.0%, a difference of 0.020%), Immigrants from Japan (91.0%, a difference of 0.030%), Immigrants from Netherlands (91.0%, a difference of 0.030%), Ukrainian (91.0%, a difference of 0.030%), and Immigrants from South Africa (91.0%, a difference of 0.040%).
| Demographics | Rating | Rank | High School Diploma |
| Serbians | 99.7 /100 | #55 | Exceptional 91.1% |
| Immigrants | Canada | 99.7 /100 | #56 | Exceptional 91.1% |
| Zimbabweans | 99.7 /100 | #57 | Exceptional 91.1% |
| Slavs | 99.7 /100 | #58 | Exceptional 91.0% |
| Immigrants | North America | 99.7 /100 | #59 | Exceptional 91.0% |
| Immigrants | Japan | 99.6 /100 | #60 | Exceptional 91.0% |
| Immigrants | Taiwan | 99.6 /100 | #61 | Exceptional 91.0% |
| Austrians | 99.6 /100 | #62 | Exceptional 91.0% |
| Immigrants | Netherlands | 99.6 /100 | #63 | Exceptional 91.0% |
| Ukrainians | 99.6 /100 | #64 | Exceptional 91.0% |
| Immigrants | South Africa | 99.6 /100 | #65 | Exceptional 91.0% |
| French | 99.5 /100 | #66 | Exceptional 91.0% |
| Immigrants | Iran | 99.5 /100 | #67 | Exceptional 90.9% |
| Czechoslovakians | 99.5 /100 | #68 | Exceptional 90.9% |
| French Canadians | 99.5 /100 | #69 | Exceptional 90.9% |
Demographics Similar to Nigerians by High School Diploma
In terms of high school diploma, the demographic groups most similar to Nigerians are Kiowa (88.2%, a difference of 0.010%), Immigrants from Liberia (88.2%, a difference of 0.020%), Uruguayan (88.2%, a difference of 0.030%), Blackfeet (88.1%, a difference of 0.080%), and Creek (88.3%, a difference of 0.11%).
| Demographics | Rating | Rank | High School Diploma |
| Colville | 7.8 /100 | #222 | Tragic 88.3% |
| Immigrants | Zaire | 7.6 /100 | #223 | Tragic 88.3% |
| Shoshone | 7.0 /100 | #224 | Tragic 88.3% |
| Creek | 6.9 /100 | #225 | Tragic 88.3% |
| Uruguayans | 5.6 /100 | #226 | Tragic 88.2% |
| Immigrants | Liberia | 5.5 /100 | #227 | Tragic 88.2% |
| Kiowa | 5.3 /100 | #228 | Tragic 88.2% |
| Nigerians | 5.2 /100 | #229 | Tragic 88.2% |
| Blackfeet | 4.2 /100 | #230 | Tragic 88.1% |
| Colombians | 3.8 /100 | #231 | Tragic 88.1% |
| Immigrants | Middle Africa | 3.4 /100 | #232 | Tragic 88.0% |
| Immigrants | Panama | 3.1 /100 | #233 | Tragic 88.0% |
| Immigrants | Thailand | 3.1 /100 | #234 | Tragic 88.0% |
| Immigrants | Bahamas | 2.9 /100 | #235 | Tragic 88.0% |
| Sub-Saharan Africans | 2.8 /100 | #236 | Tragic 87.9% |