Australian vs Fijian 6th Grade
COMPARE
Australian
Fijian
6th Grade
6th Grade Comparison
Australians
Fijians
97.8%
6TH GRADE
99.8/ 100
METRIC RATING
52nd/ 347
METRIC RANK
96.2%
6TH GRADE
0.1/ 100
METRIC RATING
284th/ 347
METRIC RANK
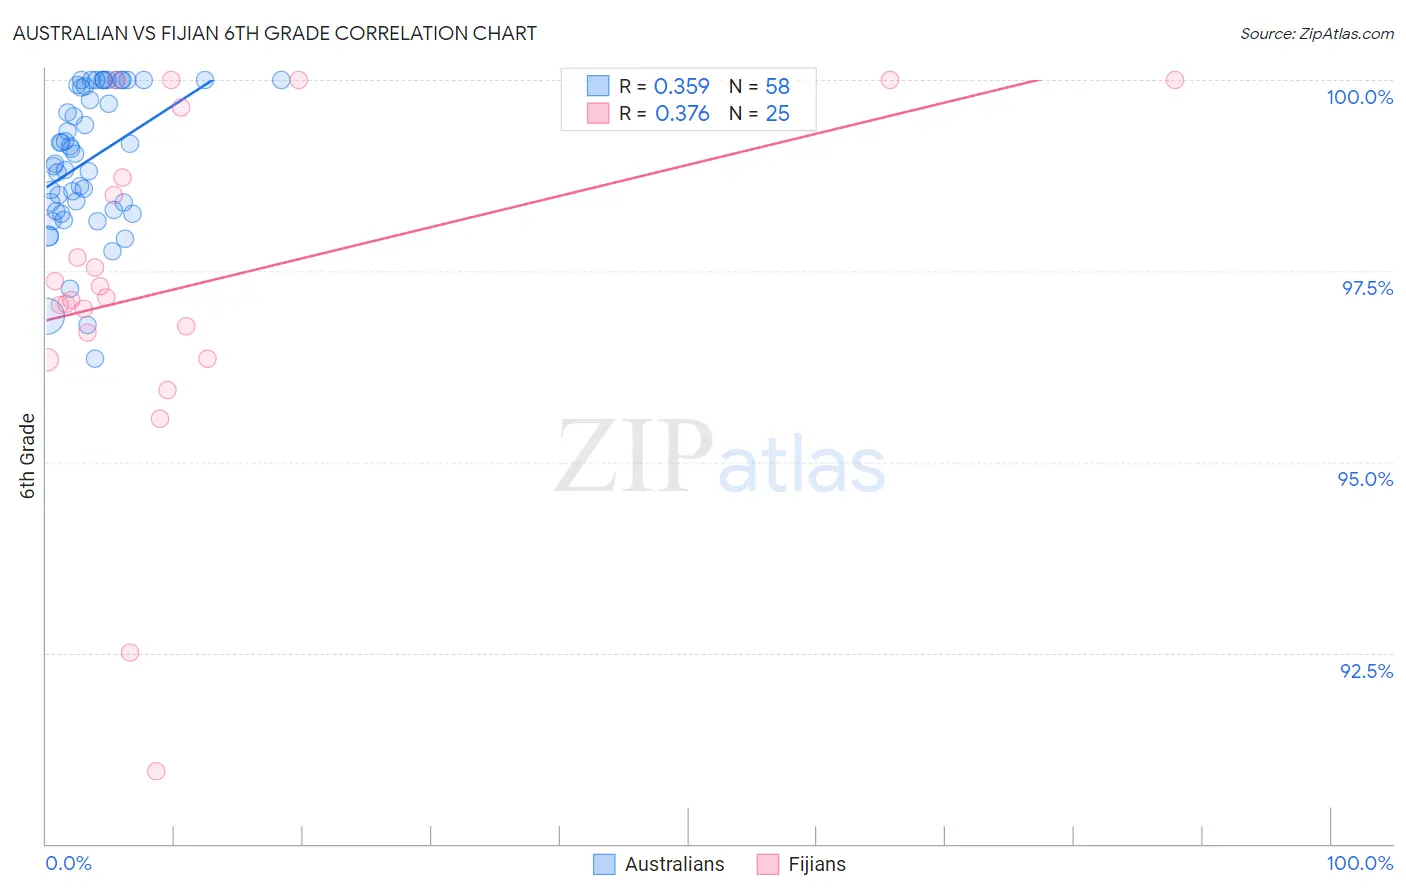
Australian vs Fijian 6th Grade Correlation Chart
The statistical analysis conducted on geographies consisting of 224,153,392 people shows a mild positive correlation between the proportion of Australians and percentage of population with at least 6th grade education in the United States with a correlation coefficient (R) of 0.359 and weighted average of 97.8%. Similarly, the statistical analysis conducted on geographies consisting of 55,948,842 people shows a mild positive correlation between the proportion of Fijians and percentage of population with at least 6th grade education in the United States with a correlation coefficient (R) of 0.376 and weighted average of 96.2%, a difference of 1.6%.
6th Grade Correlation Summary
| Measurement | Australian | Fijian |
| Minimum | 96.3% | 90.9% |
| Maximum | 100.0% | 100.0% |
| Range | 3.7% | 9.1% |
| Mean | 99.0% | 97.3% |
| Median | 99.1% | 97.2% |
| Interquartile 25% (IQ1) | 98.3% | 96.5% |
| Interquartile 75% (IQ3) | 99.9% | 99.2% |
| Interquartile Range (IQR) | 1.6% | 2.7% |
| Standard Deviation (Sample) | 0.93% | 2.2% |
| Standard Deviation (Population) | 0.92% | 2.2% |
Similar Demographics by 6th Grade
Demographics Similar to Australians by 6th Grade
In terms of 6th grade, the demographic groups most similar to Australians are Maltese (97.8%, a difference of 0.0%), Slavic (97.8%, a difference of 0.0%), Celtic (97.8%, a difference of 0.010%), Estonian (97.8%, a difference of 0.010%), and Immigrants from Scotland (97.8%, a difference of 0.010%).
| Demographics | Rating | Rank | 6th Grade |
| Bulgarians | 99.9 /100 | #45 | Exceptional 97.8% |
| Arapaho | 99.9 /100 | #46 | Exceptional 97.8% |
| Native Hawaiians | 99.9 /100 | #47 | Exceptional 97.8% |
| Celtics | 99.9 /100 | #48 | Exceptional 97.8% |
| Estonians | 99.8 /100 | #49 | Exceptional 97.8% |
| Immigrants | Scotland | 99.8 /100 | #50 | Exceptional 97.8% |
| Maltese | 99.8 /100 | #51 | Exceptional 97.8% |
| Australians | 99.8 /100 | #52 | Exceptional 97.8% |
| Slavs | 99.8 /100 | #53 | Exceptional 97.8% |
| Creek | 99.8 /100 | #54 | Exceptional 97.7% |
| Aleuts | 99.8 /100 | #55 | Exceptional 97.7% |
| Austrians | 99.8 /100 | #56 | Exceptional 97.7% |
| Whites/Caucasians | 99.8 /100 | #57 | Exceptional 97.7% |
| Greeks | 99.8 /100 | #58 | Exceptional 97.7% |
| Americans | 99.8 /100 | #59 | Exceptional 97.7% |
Demographics Similar to Fijians by 6th Grade
In terms of 6th grade, the demographic groups most similar to Fijians are Cuban (96.2%, a difference of 0.010%), Somali (96.2%, a difference of 0.010%), Immigrants from Afghanistan (96.2%, a difference of 0.020%), Trinidadian and Tobagonian (96.2%, a difference of 0.020%), and Houma (96.2%, a difference of 0.020%).
| Demographics | Rating | Rank | 6th Grade |
| Immigrants | Western Africa | 0.1 /100 | #277 | Tragic 96.3% |
| Immigrants | Thailand | 0.1 /100 | #278 | Tragic 96.3% |
| Immigrants | Peru | 0.1 /100 | #279 | Tragic 96.2% |
| Immigrants | Afghanistan | 0.1 /100 | #280 | Tragic 96.2% |
| Trinidadians and Tobagonians | 0.1 /100 | #281 | Tragic 96.2% |
| Houma | 0.1 /100 | #282 | Tragic 96.2% |
| Cubans | 0.1 /100 | #283 | Tragic 96.2% |
| Fijians | 0.1 /100 | #284 | Tragic 96.2% |
| Somalis | 0.1 /100 | #285 | Tragic 96.2% |
| Barbadians | 0.0 /100 | #286 | Tragic 96.2% |
| Immigrants | Trinidad and Tobago | 0.0 /100 | #287 | Tragic 96.2% |
| Malaysians | 0.0 /100 | #288 | Tragic 96.2% |
| Immigrants | Eritrea | 0.0 /100 | #289 | Tragic 96.1% |
| Immigrants | Somalia | 0.0 /100 | #290 | Tragic 96.1% |
| Immigrants | St. Vincent and the Grenadines | 0.0 /100 | #291 | Tragic 96.1% |