Armenian vs Mexican American Indian 6th Grade
COMPARE
Armenian
Mexican American Indian
6th Grade
6th Grade Comparison
Armenians
Mexican American Indians
96.4%
6TH GRADE
0.3/ 100
METRIC RATING
264th/ 347
METRIC RANK
95.0%
6TH GRADE
0.0/ 100
METRIC RATING
327th/ 347
METRIC RANK
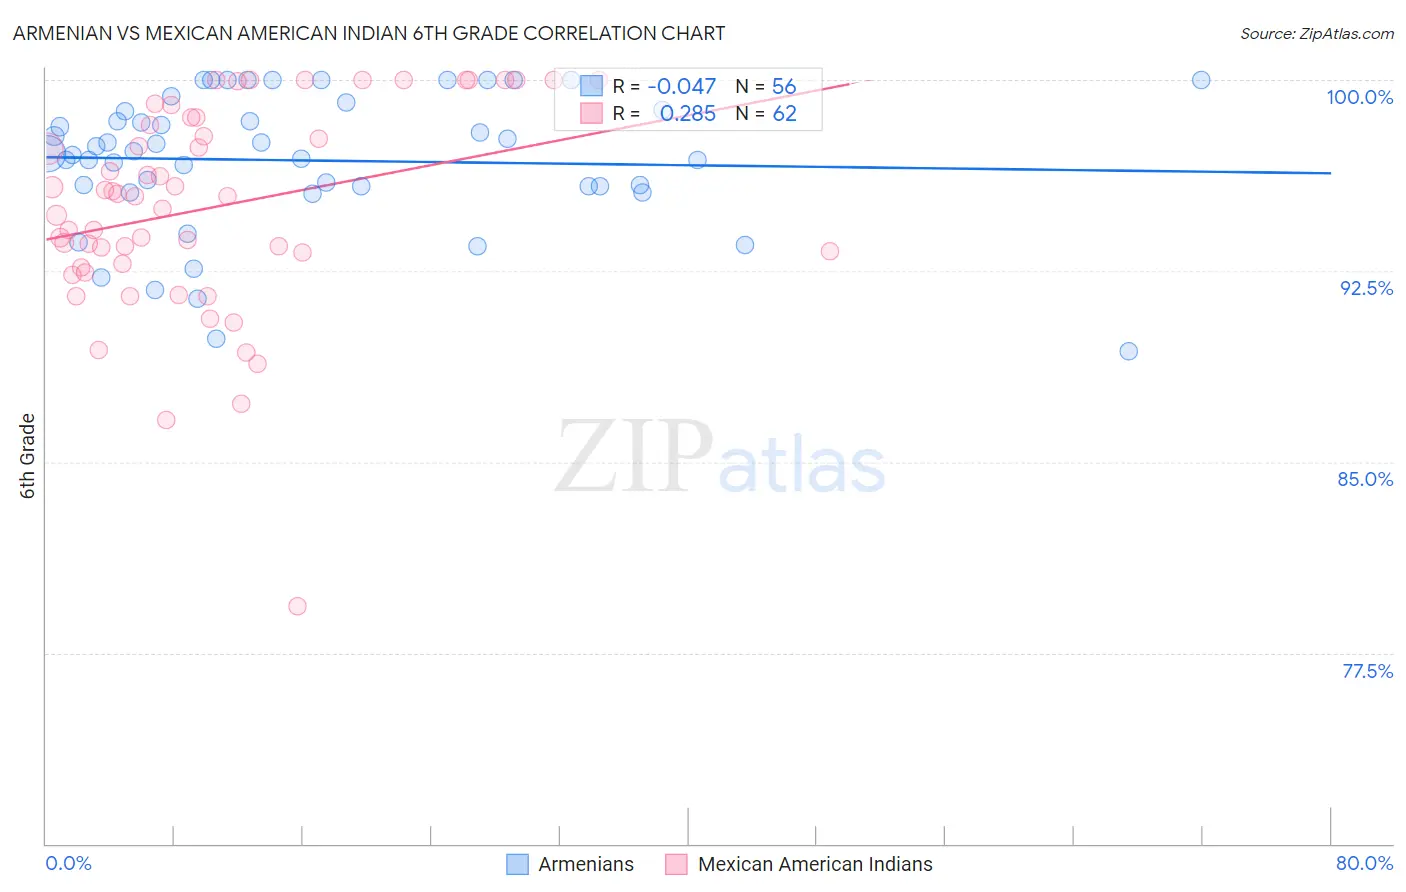
Armenian vs Mexican American Indian 6th Grade Correlation Chart
The statistical analysis conducted on geographies consisting of 310,954,151 people shows no correlation between the proportion of Armenians and percentage of population with at least 6th grade education in the United States with a correlation coefficient (R) of -0.047 and weighted average of 96.4%. Similarly, the statistical analysis conducted on geographies consisting of 317,621,104 people shows a weak positive correlation between the proportion of Mexican American Indians and percentage of population with at least 6th grade education in the United States with a correlation coefficient (R) of 0.285 and weighted average of 95.0%, a difference of 1.5%.
6th Grade Correlation Summary
| Measurement | Armenian | Mexican American Indian |
| Minimum | 89.4% | 79.3% |
| Maximum | 100.0% | 100.0% |
| Range | 10.6% | 20.7% |
| Mean | 96.8% | 95.0% |
| Median | 97.2% | 95.5% |
| Interquartile 25% (IQ1) | 95.8% | 92.8% |
| Interquartile 75% (IQ3) | 98.8% | 98.5% |
| Interquartile Range (IQR) | 3.0% | 5.8% |
| Standard Deviation (Sample) | 2.7% | 4.1% |
| Standard Deviation (Population) | 2.7% | 4.1% |
Similar Demographics by 6th Grade
Demographics Similar to Armenians by 6th Grade
In terms of 6th grade, the demographic groups most similar to Armenians are Immigrants from Colombia (96.4%, a difference of 0.0%), Immigrants from Jamaica (96.4%, a difference of 0.010%), Immigrants from Nigeria (96.4%, a difference of 0.020%), Ghanaian (96.4%, a difference of 0.020%), and Afghan (96.4%, a difference of 0.020%).
| Demographics | Rating | Rank | 6th Grade |
| Taiwanese | 0.5 /100 | #257 | Tragic 96.5% |
| Immigrants | China | 0.4 /100 | #258 | Tragic 96.4% |
| South Americans | 0.4 /100 | #259 | Tragic 96.4% |
| Peruvians | 0.4 /100 | #260 | Tragic 96.4% |
| Immigrants | Sierra Leone | 0.4 /100 | #261 | Tragic 96.4% |
| Immigrants | Nigeria | 0.3 /100 | #262 | Tragic 96.4% |
| Immigrants | Colombia | 0.3 /100 | #263 | Tragic 96.4% |
| Armenians | 0.3 /100 | #264 | Tragic 96.4% |
| Immigrants | Jamaica | 0.2 /100 | #265 | Tragic 96.4% |
| Ghanaians | 0.2 /100 | #266 | Tragic 96.4% |
| Afghans | 0.2 /100 | #267 | Tragic 96.4% |
| Immigrants | Uzbekistan | 0.2 /100 | #268 | Tragic 96.3% |
| West Indians | 0.2 /100 | #269 | Tragic 96.3% |
| Immigrants | South America | 0.2 /100 | #270 | Tragic 96.3% |
| Immigrants | Hong Kong | 0.2 /100 | #271 | Tragic 96.3% |
Demographics Similar to Mexican American Indians by 6th Grade
In terms of 6th grade, the demographic groups most similar to Mexican American Indians are Honduran (95.0%, a difference of 0.010%), Hispanic or Latino (95.0%, a difference of 0.020%), Dominican (94.9%, a difference of 0.070%), Immigrants from Nicaragua (95.1%, a difference of 0.10%), and Cape Verdean (95.1%, a difference of 0.13%).
| Demographics | Rating | Rank | 6th Grade |
| Immigrants | Ecuador | 0.0 /100 | #320 | Tragic 95.3% |
| Immigrants | Fiji | 0.0 /100 | #321 | Tragic 95.2% |
| Immigrants | Cambodia | 0.0 /100 | #322 | Tragic 95.2% |
| Central American Indians | 0.0 /100 | #323 | Tragic 95.1% |
| Cape Verdeans | 0.0 /100 | #324 | Tragic 95.1% |
| Immigrants | Nicaragua | 0.0 /100 | #325 | Tragic 95.1% |
| Hispanics or Latinos | 0.0 /100 | #326 | Tragic 95.0% |
| Mexican American Indians | 0.0 /100 | #327 | Tragic 95.0% |
| Hondurans | 0.0 /100 | #328 | Tragic 95.0% |
| Dominicans | 0.0 /100 | #329 | Tragic 94.9% |
| Nepalese | 0.0 /100 | #330 | Tragic 94.9% |
| Immigrants | Armenia | 0.0 /100 | #331 | Tragic 94.9% |
| Immigrants | Honduras | 0.0 /100 | #332 | Tragic 94.8% |
| Immigrants | Latin America | 0.0 /100 | #333 | Tragic 94.7% |
| Immigrants | Azores | 0.0 /100 | #334 | Tragic 94.7% |