Armenian vs Celtic 6th Grade
COMPARE
Armenian
Celtic
6th Grade
6th Grade Comparison
Armenians
Celtics
96.4%
6TH GRADE
0.3/ 100
METRIC RATING
264th/ 347
METRIC RANK
97.8%
6TH GRADE
99.9/ 100
METRIC RATING
48th/ 347
METRIC RANK
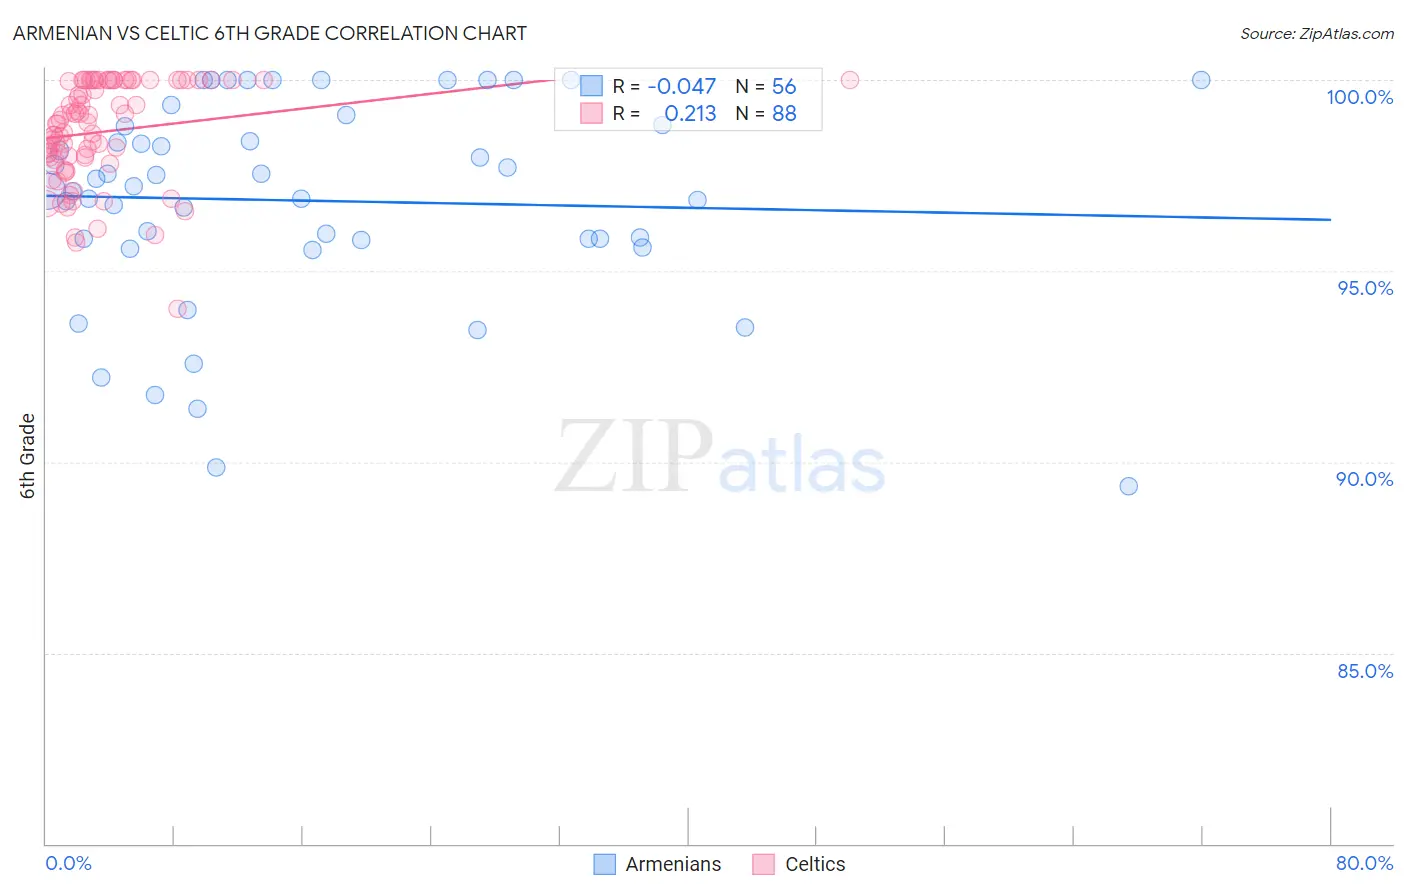
Armenian vs Celtic 6th Grade Correlation Chart
The statistical analysis conducted on geographies consisting of 310,954,151 people shows no correlation between the proportion of Armenians and percentage of population with at least 6th grade education in the United States with a correlation coefficient (R) of -0.047 and weighted average of 96.4%. Similarly, the statistical analysis conducted on geographies consisting of 168,875,705 people shows a weak positive correlation between the proportion of Celtics and percentage of population with at least 6th grade education in the United States with a correlation coefficient (R) of 0.213 and weighted average of 97.8%, a difference of 1.4%.
6th Grade Correlation Summary
| Measurement | Armenian | Celtic |
| Minimum | 89.4% | 94.0% |
| Maximum | 100.0% | 100.0% |
| Range | 10.6% | 6.0% |
| Mean | 96.8% | 98.6% |
| Median | 97.2% | 98.9% |
| Interquartile 25% (IQ1) | 95.8% | 98.0% |
| Interquartile 75% (IQ3) | 98.8% | 100.0% |
| Interquartile Range (IQR) | 3.0% | 2.0% |
| Standard Deviation (Sample) | 2.7% | 1.3% |
| Standard Deviation (Population) | 2.7% | 1.3% |
Similar Demographics by 6th Grade
Demographics Similar to Armenians by 6th Grade
In terms of 6th grade, the demographic groups most similar to Armenians are Immigrants from Colombia (96.4%, a difference of 0.0%), Immigrants from Jamaica (96.4%, a difference of 0.010%), Immigrants from Nigeria (96.4%, a difference of 0.020%), Ghanaian (96.4%, a difference of 0.020%), and Afghan (96.4%, a difference of 0.020%).
| Demographics | Rating | Rank | 6th Grade |
| Taiwanese | 0.5 /100 | #257 | Tragic 96.5% |
| Immigrants | China | 0.4 /100 | #258 | Tragic 96.4% |
| South Americans | 0.4 /100 | #259 | Tragic 96.4% |
| Peruvians | 0.4 /100 | #260 | Tragic 96.4% |
| Immigrants | Sierra Leone | 0.4 /100 | #261 | Tragic 96.4% |
| Immigrants | Nigeria | 0.3 /100 | #262 | Tragic 96.4% |
| Immigrants | Colombia | 0.3 /100 | #263 | Tragic 96.4% |
| Armenians | 0.3 /100 | #264 | Tragic 96.4% |
| Immigrants | Jamaica | 0.2 /100 | #265 | Tragic 96.4% |
| Ghanaians | 0.2 /100 | #266 | Tragic 96.4% |
| Afghans | 0.2 /100 | #267 | Tragic 96.4% |
| Immigrants | Uzbekistan | 0.2 /100 | #268 | Tragic 96.3% |
| West Indians | 0.2 /100 | #269 | Tragic 96.3% |
| Immigrants | South America | 0.2 /100 | #270 | Tragic 96.3% |
| Immigrants | Hong Kong | 0.2 /100 | #271 | Tragic 96.3% |
Demographics Similar to Celtics by 6th Grade
In terms of 6th grade, the demographic groups most similar to Celtics are Native Hawaiian (97.8%, a difference of 0.0%), Estonian (97.8%, a difference of 0.0%), Immigrants from Scotland (97.8%, a difference of 0.0%), Arapaho (97.8%, a difference of 0.010%), and Maltese (97.8%, a difference of 0.010%).
| Demographics | Rating | Rank | 6th Grade |
| Eastern Europeans | 99.9 /100 | #41 | Exceptional 97.9% |
| Hungarians | 99.9 /100 | #42 | Exceptional 97.8% |
| Northern Europeans | 99.9 /100 | #43 | Exceptional 97.8% |
| Czechoslovakians | 99.9 /100 | #44 | Exceptional 97.8% |
| Bulgarians | 99.9 /100 | #45 | Exceptional 97.8% |
| Arapaho | 99.9 /100 | #46 | Exceptional 97.8% |
| Native Hawaiians | 99.9 /100 | #47 | Exceptional 97.8% |
| Celtics | 99.9 /100 | #48 | Exceptional 97.8% |
| Estonians | 99.8 /100 | #49 | Exceptional 97.8% |
| Immigrants | Scotland | 99.8 /100 | #50 | Exceptional 97.8% |
| Maltese | 99.8 /100 | #51 | Exceptional 97.8% |
| Australians | 99.8 /100 | #52 | Exceptional 97.8% |
| Slavs | 99.8 /100 | #53 | Exceptional 97.8% |
| Creek | 99.8 /100 | #54 | Exceptional 97.7% |
| Aleuts | 99.8 /100 | #55 | Exceptional 97.7% |