Argentinean vs Immigrants from Ireland Kindergarten
COMPARE
Argentinean
Immigrants from Ireland
Kindergarten
Kindergarten Comparison
Argentineans
Immigrants from Ireland
97.9%
KINDERGARTEN
46.8/ 100
METRIC RATING
179th/ 347
METRIC RANK
98.2%
KINDERGARTEN
97.6/ 100
METRIC RATING
103rd/ 347
METRIC RANK
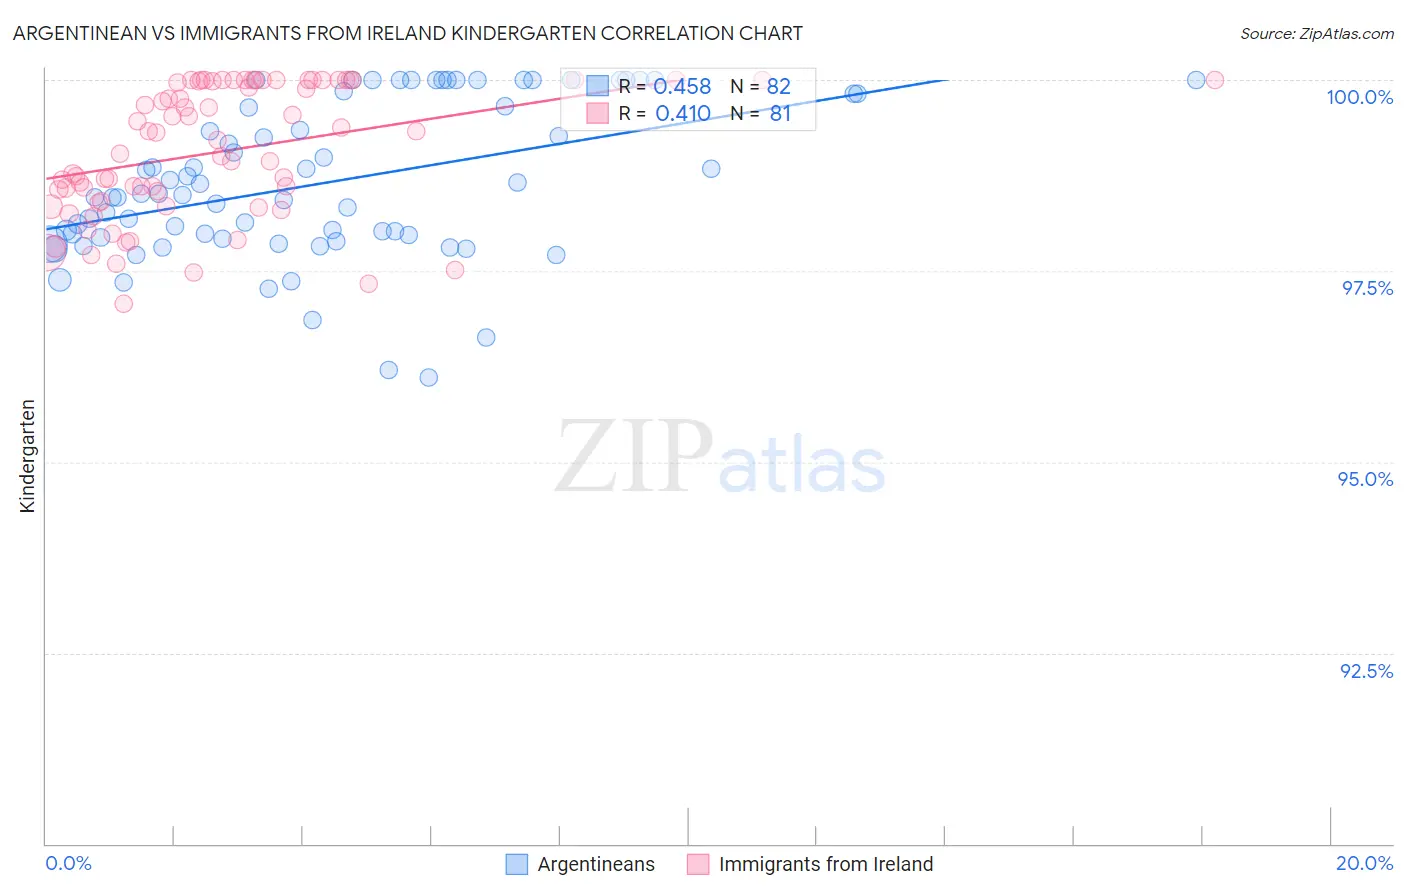
Argentinean vs Immigrants from Ireland Kindergarten Correlation Chart
The statistical analysis conducted on geographies consisting of 297,146,811 people shows a moderate positive correlation between the proportion of Argentineans and percentage of population with at least kindergarten education in the United States with a correlation coefficient (R) of 0.458 and weighted average of 97.9%. Similarly, the statistical analysis conducted on geographies consisting of 240,784,498 people shows a moderate positive correlation between the proportion of Immigrants from Ireland and percentage of population with at least kindergarten education in the United States with a correlation coefficient (R) of 0.410 and weighted average of 98.2%, a difference of 0.30%.
Kindergarten Correlation Summary
| Measurement | Argentinean | Immigrants from Ireland |
| Minimum | 96.1% | 97.1% |
| Maximum | 100.0% | 100.0% |
| Range | 3.9% | 2.9% |
| Mean | 98.7% | 99.1% |
| Median | 98.5% | 99.2% |
| Interquartile 25% (IQ1) | 97.9% | 98.4% |
| Interquartile 75% (IQ3) | 99.8% | 100.0% |
| Interquartile Range (IQR) | 1.9% | 1.6% |
| Standard Deviation (Sample) | 1.0% | 0.85% |
| Standard Deviation (Population) | 1.00% | 0.85% |
Similar Demographics by Kindergarten
Demographics Similar to Argentineans by Kindergarten
In terms of kindergarten, the demographic groups most similar to Argentineans are Immigrants from Venezuela (97.9%, a difference of 0.0%), Brazilian (97.9%, a difference of 0.0%), Immigrants from Bosnia and Herzegovina (97.9%, a difference of 0.0%), Native/Alaskan (98.0%, a difference of 0.010%), and Kenyan (98.0%, a difference of 0.010%).
| Demographics | Rating | Rank | Kindergarten |
| Natives/Alaskans | 51.0 /100 | #172 | Average 98.0% |
| Kenyans | 51.0 /100 | #173 | Average 98.0% |
| Immigrants | Brazil | 50.0 /100 | #174 | Average 98.0% |
| Immigrants | Sri Lanka | 49.6 /100 | #175 | Average 97.9% |
| Albanians | 48.5 /100 | #176 | Average 97.9% |
| Immigrants | Venezuela | 47.9 /100 | #177 | Average 97.9% |
| Brazilians | 47.6 /100 | #178 | Average 97.9% |
| Argentineans | 46.8 /100 | #179 | Average 97.9% |
| Immigrants | Bosnia and Herzegovina | 46.7 /100 | #180 | Average 97.9% |
| Portuguese | 43.5 /100 | #181 | Average 97.9% |
| Egyptians | 42.4 /100 | #182 | Average 97.9% |
| Immigrants | Poland | 41.4 /100 | #183 | Average 97.9% |
| Immigrants | Argentina | 40.7 /100 | #184 | Average 97.9% |
| Immigrants | Belarus | 39.4 /100 | #185 | Fair 97.9% |
| Pakistanis | 36.0 /100 | #186 | Fair 97.9% |
Demographics Similar to Immigrants from Ireland by Kindergarten
In terms of kindergarten, the demographic groups most similar to Immigrants from Ireland are Cree (98.2%, a difference of 0.0%), Romanian (98.2%, a difference of 0.010%), Bhutanese (98.2%, a difference of 0.010%), Pima (98.2%, a difference of 0.010%), and Basque (98.2%, a difference of 0.010%).
| Demographics | Rating | Rank | Kindergarten |
| Immigrants | Nonimmigrants | 98.3 /100 | #96 | Exceptional 98.3% |
| Cypriots | 98.3 /100 | #97 | Exceptional 98.3% |
| Choctaw | 98.2 /100 | #98 | Exceptional 98.3% |
| Colville | 98.2 /100 | #99 | Exceptional 98.3% |
| Puget Sound Salish | 98.1 /100 | #100 | Exceptional 98.2% |
| Romanians | 97.8 /100 | #101 | Exceptional 98.2% |
| Cree | 97.7 /100 | #102 | Exceptional 98.2% |
| Immigrants | Ireland | 97.6 /100 | #103 | Exceptional 98.2% |
| Bhutanese | 97.3 /100 | #104 | Exceptional 98.2% |
| Pima | 97.3 /100 | #105 | Exceptional 98.2% |
| Basques | 97.3 /100 | #106 | Exceptional 98.2% |
| Turks | 97.3 /100 | #107 | Exceptional 98.2% |
| Immigrants | Switzerland | 97.2 /100 | #108 | Exceptional 98.2% |
| German Russians | 97.1 /100 | #109 | Exceptional 98.2% |
| Immigrants | Singapore | 96.8 /100 | #110 | Exceptional 98.2% |