Arapaho vs Potawatomi High School Diploma
COMPARE
Arapaho
Potawatomi
High School Diploma
High School Diploma Comparison
Arapaho
Potawatomi
88.6%
HIGH SCHOOL DIPLOMA
16.1/ 100
METRIC RATING
206th/ 347
METRIC RANK
89.0%
HIGH SCHOOL DIPLOMA
42.5/ 100
METRIC RATING
183rd/ 347
METRIC RANK
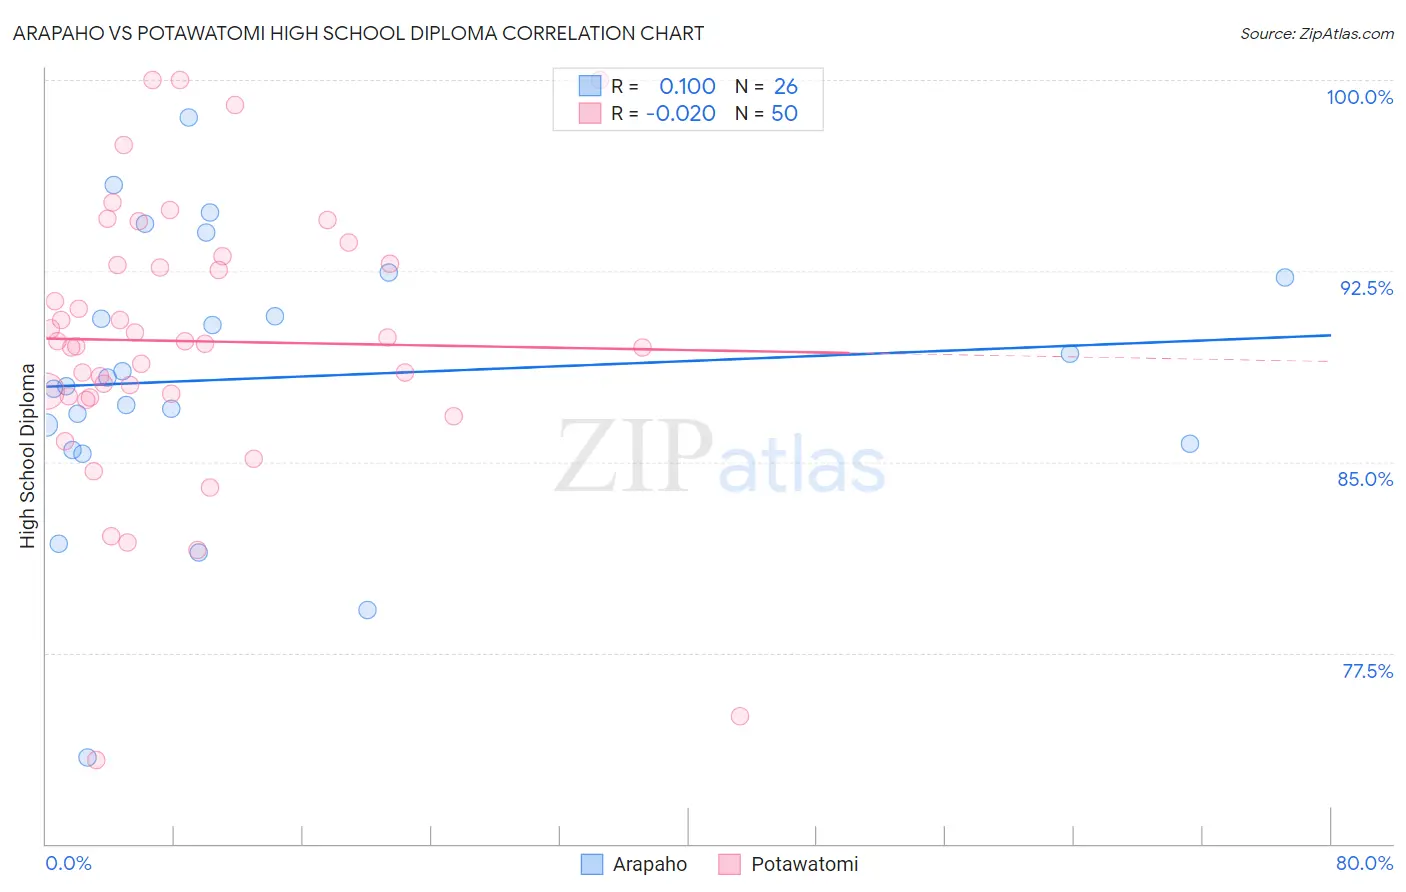
Arapaho vs Potawatomi High School Diploma Correlation Chart
The statistical analysis conducted on geographies consisting of 29,780,040 people shows a slight positive correlation between the proportion of Arapaho and percentage of population with at least high school diploma education in the United States with a correlation coefficient (R) of 0.100 and weighted average of 88.6%. Similarly, the statistical analysis conducted on geographies consisting of 117,774,178 people shows no correlation between the proportion of Potawatomi and percentage of population with at least high school diploma education in the United States with a correlation coefficient (R) of -0.020 and weighted average of 89.0%, a difference of 0.51%.
High School Diploma Correlation Summary
| Measurement | Arapaho | Potawatomi |
| Minimum | 73.4% | 73.3% |
| Maximum | 98.5% | 100.0% |
| Range | 25.1% | 26.7% |
| Mean | 88.3% | 89.7% |
| Median | 88.1% | 89.7% |
| Interquartile 25% (IQ1) | 85.7% | 87.6% |
| Interquartile 75% (IQ3) | 92.3% | 92.8% |
| Interquartile Range (IQR) | 6.5% | 5.2% |
| Standard Deviation (Sample) | 5.5% | 5.5% |
| Standard Deviation (Population) | 5.4% | 5.4% |
Similar Demographics by High School Diploma
Demographics Similar to Arapaho by High School Diploma
In terms of high school diploma, the demographic groups most similar to Arapaho are Immigrants from Micronesia (88.6%, a difference of 0.010%), Immigrants from Sierra Leone (88.6%, a difference of 0.010%), Armenian (88.6%, a difference of 0.030%), Somali (88.6%, a difference of 0.040%), and Panamanian (88.6%, a difference of 0.050%).
| Demographics | Rating | Rank | High School Diploma |
| Marshallese | 18.7 /100 | #199 | Poor 88.6% |
| Hawaiians | 18.3 /100 | #200 | Poor 88.6% |
| Koreans | 18.1 /100 | #201 | Poor 88.6% |
| Panamanians | 18.0 /100 | #202 | Poor 88.6% |
| Somalis | 17.5 /100 | #203 | Poor 88.6% |
| Armenians | 17.2 /100 | #204 | Poor 88.6% |
| Immigrants | Micronesia | 16.4 /100 | #205 | Poor 88.6% |
| Arapaho | 16.1 /100 | #206 | Poor 88.6% |
| Immigrants | Sierra Leone | 15.8 /100 | #207 | Poor 88.6% |
| Portuguese | 14.4 /100 | #208 | Poor 88.5% |
| Cherokee | 14.3 /100 | #209 | Poor 88.5% |
| Samoans | 14.0 /100 | #210 | Poor 88.5% |
| Inupiat | 13.1 /100 | #211 | Poor 88.5% |
| South American Indians | 12.2 /100 | #212 | Poor 88.5% |
| Immigrants | Somalia | 11.3 /100 | #213 | Poor 88.4% |
Demographics Similar to Potawatomi by High School Diploma
In terms of high school diploma, the demographic groups most similar to Potawatomi are Spaniard (89.1%, a difference of 0.010%), Venezuelan (89.1%, a difference of 0.020%), Bolivian (89.1%, a difference of 0.040%), Immigrants from Syria (89.0%, a difference of 0.050%), and American (89.1%, a difference of 0.070%).
| Demographics | Rating | Rank | High School Diploma |
| Osage | 48.9 /100 | #176 | Average 89.1% |
| Sudanese | 48.5 /100 | #177 | Average 89.1% |
| Sierra Leoneans | 48.4 /100 | #178 | Average 89.1% |
| Americans | 47.2 /100 | #179 | Average 89.1% |
| Bolivians | 45.2 /100 | #180 | Average 89.1% |
| Venezuelans | 43.6 /100 | #181 | Average 89.1% |
| Spaniards | 43.4 /100 | #182 | Average 89.1% |
| Potawatomi | 42.5 /100 | #183 | Average 89.0% |
| Immigrants | Syria | 39.2 /100 | #184 | Fair 89.0% |
| Ethiopians | 37.0 /100 | #185 | Fair 89.0% |
| Immigrants | Eastern Africa | 35.8 /100 | #186 | Fair 88.9% |
| Guamanians/Chamorros | 35.5 /100 | #187 | Fair 88.9% |
| Immigrants | Sudan | 33.4 /100 | #188 | Fair 88.9% |
| Immigrants | Uganda | 32.6 /100 | #189 | Fair 88.9% |
| Immigrants | Chile | 31.9 /100 | #190 | Fair 88.9% |