Alsatian vs Jordanian Professional Degree
COMPARE
Alsatian
Jordanian
Professional Degree
Professional Degree Comparison
Alsatians
Jordanians
5.2%
PROFESSIONAL DEGREE
99.3/ 100
METRIC RATING
94th/ 347
METRIC RANK
4.7%
PROFESSIONAL DEGREE
88.9/ 100
METRIC RATING
137th/ 347
METRIC RANK
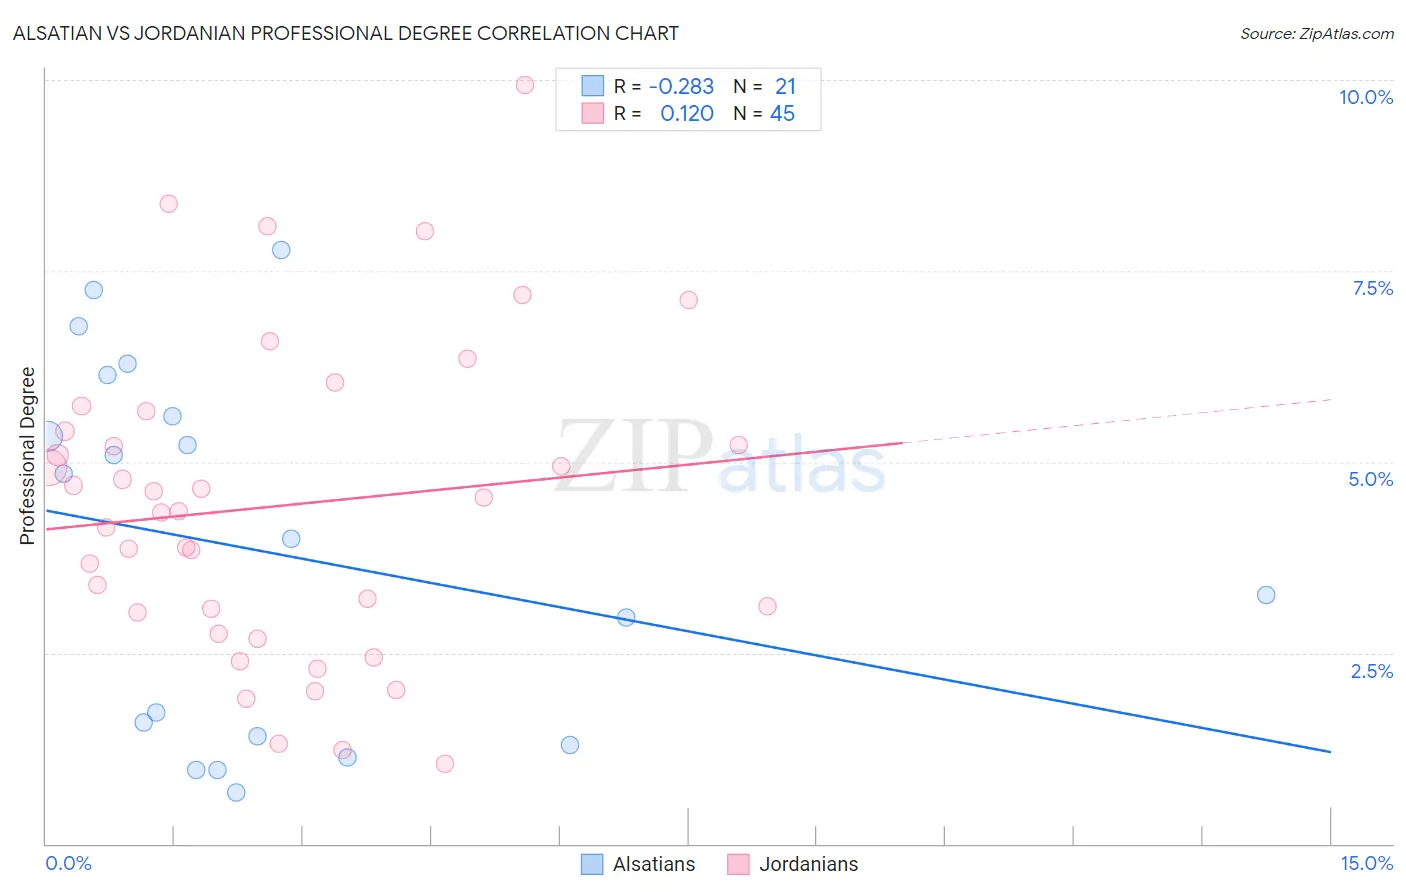
Alsatian vs Jordanian Professional Degree Correlation Chart
The statistical analysis conducted on geographies consisting of 82,635,637 people shows a weak negative correlation between the proportion of Alsatians and percentage of population with at least professional degree education in the United States with a correlation coefficient (R) of -0.283 and weighted average of 5.2%. Similarly, the statistical analysis conducted on geographies consisting of 166,340,382 people shows a poor positive correlation between the proportion of Jordanians and percentage of population with at least professional degree education in the United States with a correlation coefficient (R) of 0.120 and weighted average of 4.7%, a difference of 9.9%.
Professional Degree Correlation Summary
| Measurement | Alsatian | Jordanian |
| Minimum | 0.66% | 1.0% |
| Maximum | 7.8% | 9.9% |
| Range | 7.1% | 8.9% |
| Mean | 3.8% | 4.4% |
| Median | 4.0% | 4.4% |
| Interquartile 25% (IQ1) | 1.4% | 2.9% |
| Interquartile 75% (IQ3) | 5.9% | 5.5% |
| Interquartile Range (IQR) | 4.5% | 2.7% |
| Standard Deviation (Sample) | 2.4% | 2.0% |
| Standard Deviation (Population) | 2.3% | 2.0% |
Similar Demographics by Professional Degree
Demographics Similar to Alsatians by Professional Degree
In terms of professional degree, the demographic groups most similar to Alsatians are Northern European (5.2%, a difference of 0.020%), Zimbabwean (5.2%, a difference of 0.18%), Immigrants from Uzbekistan (5.2%, a difference of 0.59%), Immigrants from Eastern Europe (5.2%, a difference of 0.66%), and Laotian (5.2%, a difference of 0.70%).
| Demographics | Rating | Rank | Professional Degree |
| Immigrants | Chile | 99.5 /100 | #87 | Exceptional 5.3% |
| Egyptians | 99.5 /100 | #88 | Exceptional 5.3% |
| Chileans | 99.5 /100 | #89 | Exceptional 5.3% |
| Immigrants | Scotland | 99.5 /100 | #90 | Exceptional 5.3% |
| Laotians | 99.5 /100 | #91 | Exceptional 5.2% |
| Immigrants | Eastern Europe | 99.5 /100 | #92 | Exceptional 5.2% |
| Northern Europeans | 99.3 /100 | #93 | Exceptional 5.2% |
| Alsatians | 99.3 /100 | #94 | Exceptional 5.2% |
| Zimbabweans | 99.3 /100 | #95 | Exceptional 5.2% |
| Immigrants | Uzbekistan | 99.2 /100 | #96 | Exceptional 5.2% |
| Syrians | 99.1 /100 | #97 | Exceptional 5.2% |
| Austrians | 99.1 /100 | #98 | Exceptional 5.2% |
| Immigrants | Italy | 99.1 /100 | #99 | Exceptional 5.2% |
| Ugandans | 98.8 /100 | #100 | Exceptional 5.1% |
| Immigrants | Egypt | 98.5 /100 | #101 | Exceptional 5.1% |
Demographics Similar to Jordanians by Professional Degree
In terms of professional degree, the demographic groups most similar to Jordanians are Immigrants from Jordan (4.7%, a difference of 0.020%), Afghan (4.7%, a difference of 0.040%), Macedonian (4.8%, a difference of 0.30%), South American Indian (4.8%, a difference of 0.34%), and Italian (4.8%, a difference of 0.46%).
| Demographics | Rating | Rank | Professional Degree |
| Icelanders | 91.5 /100 | #130 | Exceptional 4.8% |
| Immigrants | Nepal | 91.4 /100 | #131 | Exceptional 4.8% |
| Pakistanis | 90.9 /100 | #132 | Exceptional 4.8% |
| Italians | 90.2 /100 | #133 | Exceptional 4.8% |
| South American Indians | 89.9 /100 | #134 | Excellent 4.8% |
| Macedonians | 89.8 /100 | #135 | Excellent 4.8% |
| Immigrants | Jordan | 89.0 /100 | #136 | Excellent 4.7% |
| Jordanians | 88.9 /100 | #137 | Excellent 4.7% |
| Afghans | 88.8 /100 | #138 | Excellent 4.7% |
| South Americans | 85.6 /100 | #139 | Excellent 4.7% |
| Canadians | 84.4 /100 | #140 | Excellent 4.7% |
| Basques | 81.8 /100 | #141 | Excellent 4.6% |
| Sudanese | 81.3 /100 | #142 | Excellent 4.6% |
| Hungarians | 80.8 /100 | #143 | Excellent 4.6% |
| Immigrants | South America | 80.5 /100 | #144 | Excellent 4.6% |