Alaska Native vs Immigrants from Nigeria 5th Grade
COMPARE
Alaska Native
Immigrants from Nigeria
5th Grade
5th Grade Comparison
Alaska Natives
Immigrants from Nigeria
98.2%
5TH GRADE
100.0/ 100
METRIC RATING
26th/ 347
METRIC RANK
96.7%
5TH GRADE
0.3/ 100
METRIC RATING
266th/ 347
METRIC RANK
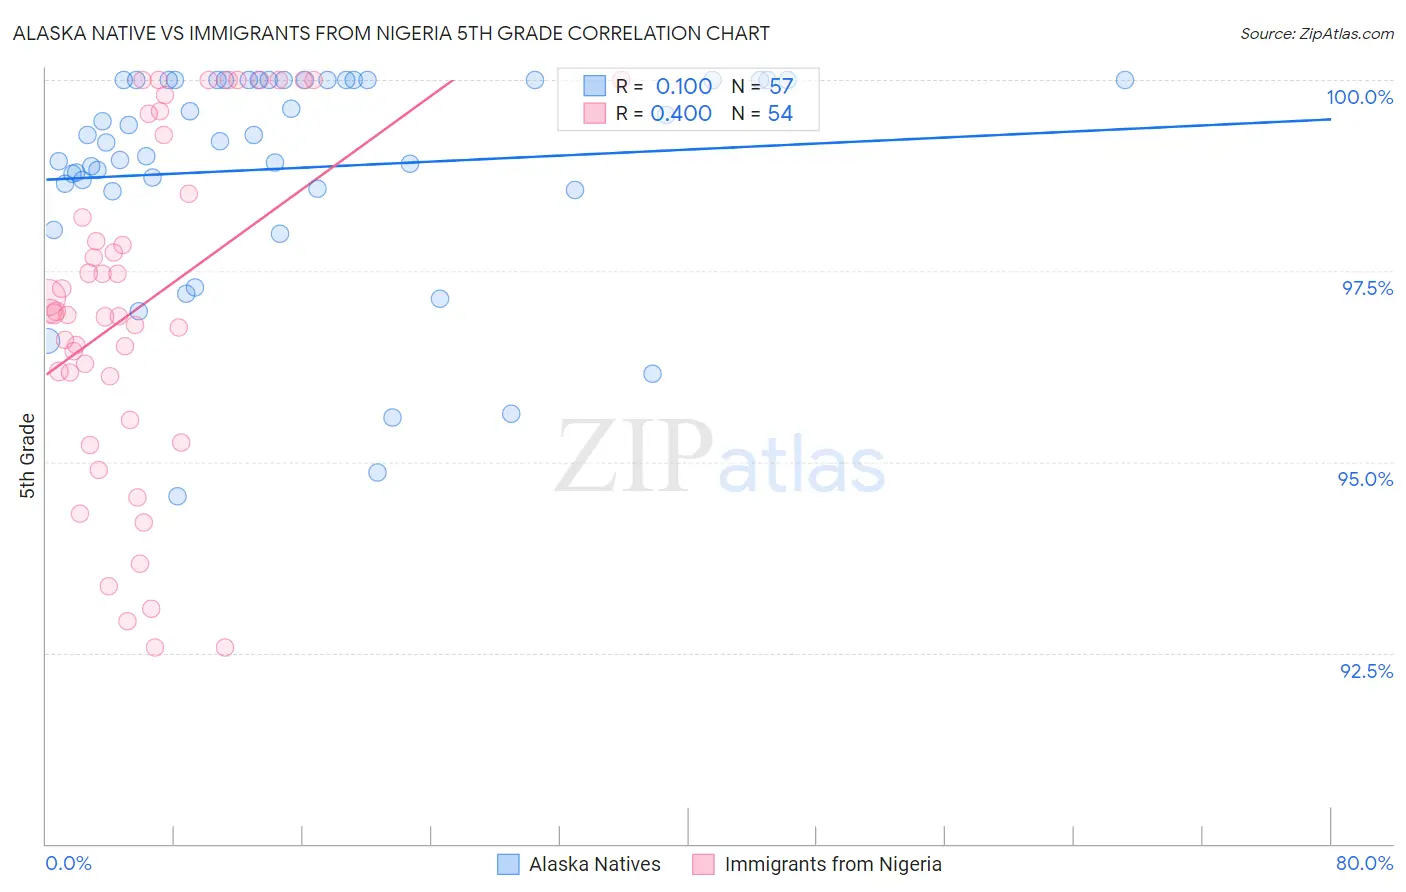
Alaska Native vs Immigrants from Nigeria 5th Grade Correlation Chart
The statistical analysis conducted on geographies consisting of 76,775,774 people shows a slight positive correlation between the proportion of Alaska Natives and percentage of population with at least 5th grade education in the United States with a correlation coefficient (R) of 0.100 and weighted average of 98.2%. Similarly, the statistical analysis conducted on geographies consisting of 283,430,369 people shows a mild positive correlation between the proportion of Immigrants from Nigeria and percentage of population with at least 5th grade education in the United States with a correlation coefficient (R) of 0.400 and weighted average of 96.7%, a difference of 1.5%.
5th Grade Correlation Summary
| Measurement | Alaska Native | Immigrants from Nigeria |
| Minimum | 94.6% | 92.6% |
| Maximum | 100.0% | 100.0% |
| Range | 5.4% | 7.4% |
| Mean | 98.8% | 97.1% |
| Median | 99.2% | 96.9% |
| Interquartile 25% (IQ1) | 98.6% | 96.1% |
| Interquartile 75% (IQ3) | 100.0% | 99.3% |
| Interquartile Range (IQR) | 1.4% | 3.2% |
| Standard Deviation (Sample) | 1.4% | 2.2% |
| Standard Deviation (Population) | 1.4% | 2.2% |
Similar Demographics by 5th Grade
Demographics Similar to Alaska Natives by 5th Grade
In terms of 5th grade, the demographic groups most similar to Alaska Natives are Yup'ik (98.2%, a difference of 0.0%), Croatian (98.2%, a difference of 0.010%), Sioux (98.2%, a difference of 0.010%), Scotch-Irish (98.2%, a difference of 0.010%), and French (98.2%, a difference of 0.010%).
| Demographics | Rating | Rank | 5th Grade |
| Finns | 100.0 /100 | #19 | Exceptional 98.2% |
| Lithuanians | 100.0 /100 | #20 | Exceptional 98.2% |
| Danes | 100.0 /100 | #21 | Exceptional 98.2% |
| Croatians | 100.0 /100 | #22 | Exceptional 98.2% |
| Sioux | 100.0 /100 | #23 | Exceptional 98.2% |
| Scotch-Irish | 100.0 /100 | #24 | Exceptional 98.2% |
| Yup'ik | 100.0 /100 | #25 | Exceptional 98.2% |
| Alaska Natives | 100.0 /100 | #26 | Exceptional 98.2% |
| French | 100.0 /100 | #27 | Exceptional 98.2% |
| Czechs | 100.0 /100 | #28 | Exceptional 98.2% |
| Scandinavians | 100.0 /100 | #29 | Exceptional 98.2% |
| French Canadians | 100.0 /100 | #30 | Exceptional 98.2% |
| Europeans | 100.0 /100 | #31 | Exceptional 98.2% |
| Chippewa | 100.0 /100 | #32 | Exceptional 98.1% |
| Swiss | 100.0 /100 | #33 | Exceptional 98.1% |
Demographics Similar to Immigrants from Nigeria by 5th Grade
In terms of 5th grade, the demographic groups most similar to Immigrants from Nigeria are Immigrants from Uzbekistan (96.8%, a difference of 0.010%), West Indian (96.8%, a difference of 0.010%), Taiwanese (96.7%, a difference of 0.010%), Immigrants from South America (96.7%, a difference of 0.010%), and Armenian (96.7%, a difference of 0.010%).
| Demographics | Rating | Rank | 5th Grade |
| Immigrants | China | 0.5 /100 | #259 | Tragic 96.8% |
| Immigrants | Jamaica | 0.4 /100 | #260 | Tragic 96.8% |
| Immigrants | Sierra Leone | 0.4 /100 | #261 | Tragic 96.8% |
| Immigrants | Colombia | 0.4 /100 | #262 | Tragic 96.8% |
| Immigrants | Uzbekistan | 0.3 /100 | #263 | Tragic 96.8% |
| West Indians | 0.3 /100 | #264 | Tragic 96.8% |
| Taiwanese | 0.3 /100 | #265 | Tragic 96.7% |
| Immigrants | Nigeria | 0.3 /100 | #266 | Tragic 96.7% |
| Immigrants | South America | 0.3 /100 | #267 | Tragic 96.7% |
| Armenians | 0.3 /100 | #268 | Tragic 96.7% |
| Ghanaians | 0.2 /100 | #269 | Tragic 96.7% |
| Afghans | 0.2 /100 | #270 | Tragic 96.7% |
| Immigrants | Hong Kong | 0.2 /100 | #271 | Tragic 96.7% |
| Trinidadians and Tobagonians | 0.1 /100 | #272 | Tragic 96.7% |
| Yaqui | 0.1 /100 | #273 | Tragic 96.7% |