Alaska Native vs Ethiopian 5th Grade
COMPARE
Alaska Native
Ethiopian
5th Grade
5th Grade Comparison
Alaska Natives
Ethiopians
98.2%
5TH GRADE
100.0/ 100
METRIC RATING
26th/ 347
METRIC RANK
96.9%
5TH GRADE
1.2/ 100
METRIC RATING
246th/ 347
METRIC RANK
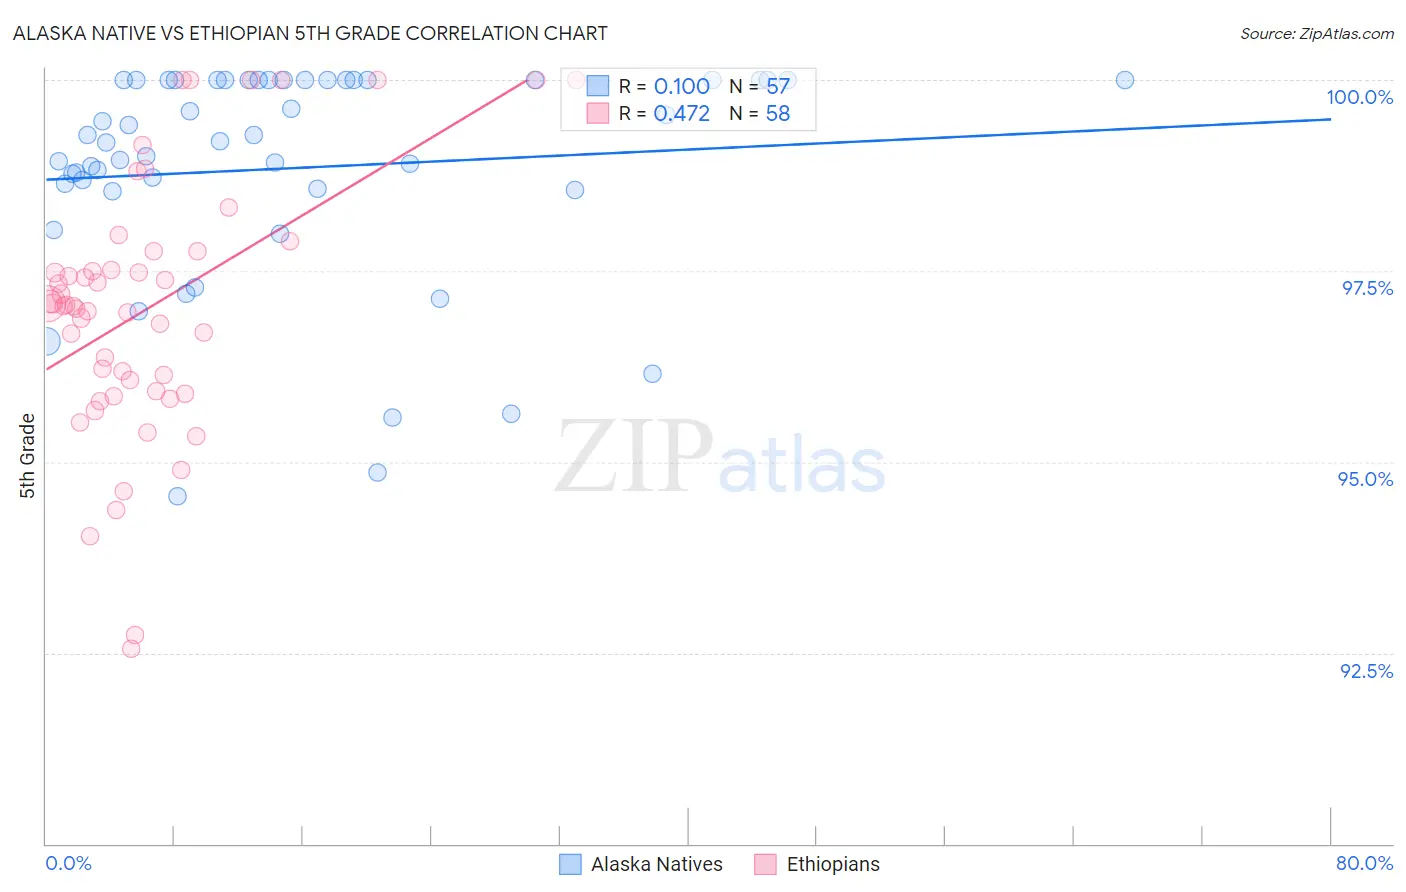
Alaska Native vs Ethiopian 5th Grade Correlation Chart
The statistical analysis conducted on geographies consisting of 76,775,774 people shows a slight positive correlation between the proportion of Alaska Natives and percentage of population with at least 5th grade education in the United States with a correlation coefficient (R) of 0.100 and weighted average of 98.2%. Similarly, the statistical analysis conducted on geographies consisting of 223,120,541 people shows a moderate positive correlation between the proportion of Ethiopians and percentage of population with at least 5th grade education in the United States with a correlation coefficient (R) of 0.472 and weighted average of 96.9%, a difference of 1.3%.
5th Grade Correlation Summary
| Measurement | Alaska Native | Ethiopian |
| Minimum | 94.6% | 92.6% |
| Maximum | 100.0% | 100.0% |
| Range | 5.4% | 7.4% |
| Mean | 98.8% | 97.0% |
| Median | 99.2% | 97.1% |
| Interquartile 25% (IQ1) | 98.6% | 95.9% |
| Interquartile 75% (IQ3) | 100.0% | 97.8% |
| Interquartile Range (IQR) | 1.4% | 1.8% |
| Standard Deviation (Sample) | 1.4% | 1.7% |
| Standard Deviation (Population) | 1.4% | 1.7% |
Similar Demographics by 5th Grade
Demographics Similar to Alaska Natives by 5th Grade
In terms of 5th grade, the demographic groups most similar to Alaska Natives are Yup'ik (98.2%, a difference of 0.0%), Croatian (98.2%, a difference of 0.010%), Sioux (98.2%, a difference of 0.010%), Scotch-Irish (98.2%, a difference of 0.010%), and French (98.2%, a difference of 0.010%).
| Demographics | Rating | Rank | 5th Grade |
| Finns | 100.0 /100 | #19 | Exceptional 98.2% |
| Lithuanians | 100.0 /100 | #20 | Exceptional 98.2% |
| Danes | 100.0 /100 | #21 | Exceptional 98.2% |
| Croatians | 100.0 /100 | #22 | Exceptional 98.2% |
| Sioux | 100.0 /100 | #23 | Exceptional 98.2% |
| Scotch-Irish | 100.0 /100 | #24 | Exceptional 98.2% |
| Yup'ik | 100.0 /100 | #25 | Exceptional 98.2% |
| Alaska Natives | 100.0 /100 | #26 | Exceptional 98.2% |
| French | 100.0 /100 | #27 | Exceptional 98.2% |
| Czechs | 100.0 /100 | #28 | Exceptional 98.2% |
| Scandinavians | 100.0 /100 | #29 | Exceptional 98.2% |
| French Canadians | 100.0 /100 | #30 | Exceptional 98.2% |
| Europeans | 100.0 /100 | #31 | Exceptional 98.2% |
| Chippewa | 100.0 /100 | #32 | Exceptional 98.1% |
| Swiss | 100.0 /100 | #33 | Exceptional 98.1% |
Demographics Similar to Ethiopians by 5th Grade
In terms of 5th grade, the demographic groups most similar to Ethiopians are Colombian (96.9%, a difference of 0.010%), Immigrants from Africa (96.9%, a difference of 0.010%), U.S. Virgin Islander (96.9%, a difference of 0.010%), Immigrants from Uruguay (96.9%, a difference of 0.020%), and Immigrants from Liberia (96.9%, a difference of 0.020%).
| Demographics | Rating | Rank | 5th Grade |
| Nigerians | 1.9 /100 | #239 | Tragic 96.9% |
| Indians (Asian) | 1.9 /100 | #240 | Tragic 96.9% |
| Immigrants | Asia | 1.7 /100 | #241 | Tragic 96.9% |
| Immigrants | Costa Rica | 1.6 /100 | #242 | Tragic 96.9% |
| Immigrants | Eastern Africa | 1.6 /100 | #243 | Tragic 96.9% |
| Koreans | 1.6 /100 | #244 | Tragic 96.9% |
| Colombians | 1.3 /100 | #245 | Tragic 96.9% |
| Ethiopians | 1.2 /100 | #246 | Tragic 96.9% |
| Immigrants | Africa | 1.1 /100 | #247 | Tragic 96.9% |
| U.S. Virgin Islanders | 1.1 /100 | #248 | Tragic 96.9% |
| Immigrants | Uruguay | 1.0 /100 | #249 | Tragic 96.9% |
| Immigrants | Liberia | 1.0 /100 | #250 | Tragic 96.9% |
| Bolivians | 0.9 /100 | #251 | Tragic 96.9% |
| Jamaicans | 0.9 /100 | #252 | Tragic 96.9% |
| Immigrants | Middle Africa | 0.8 /100 | #253 | Tragic 96.8% |