Yaqui vs Immigrants from Germany Disability Age 18 to 34
COMPARE
Yaqui
Immigrants from Germany
Disability Age 18 to 34
Disability Age 18 to 34 Comparison
Yaqui
Immigrants from Germany
7.4%
DISABILITY AGE 18 TO 34
0.1/ 100
METRIC RATING
280th/ 347
METRIC RANK
7.2%
DISABILITY AGE 18 TO 34
0.4/ 100
METRIC RATING
255th/ 347
METRIC RANK
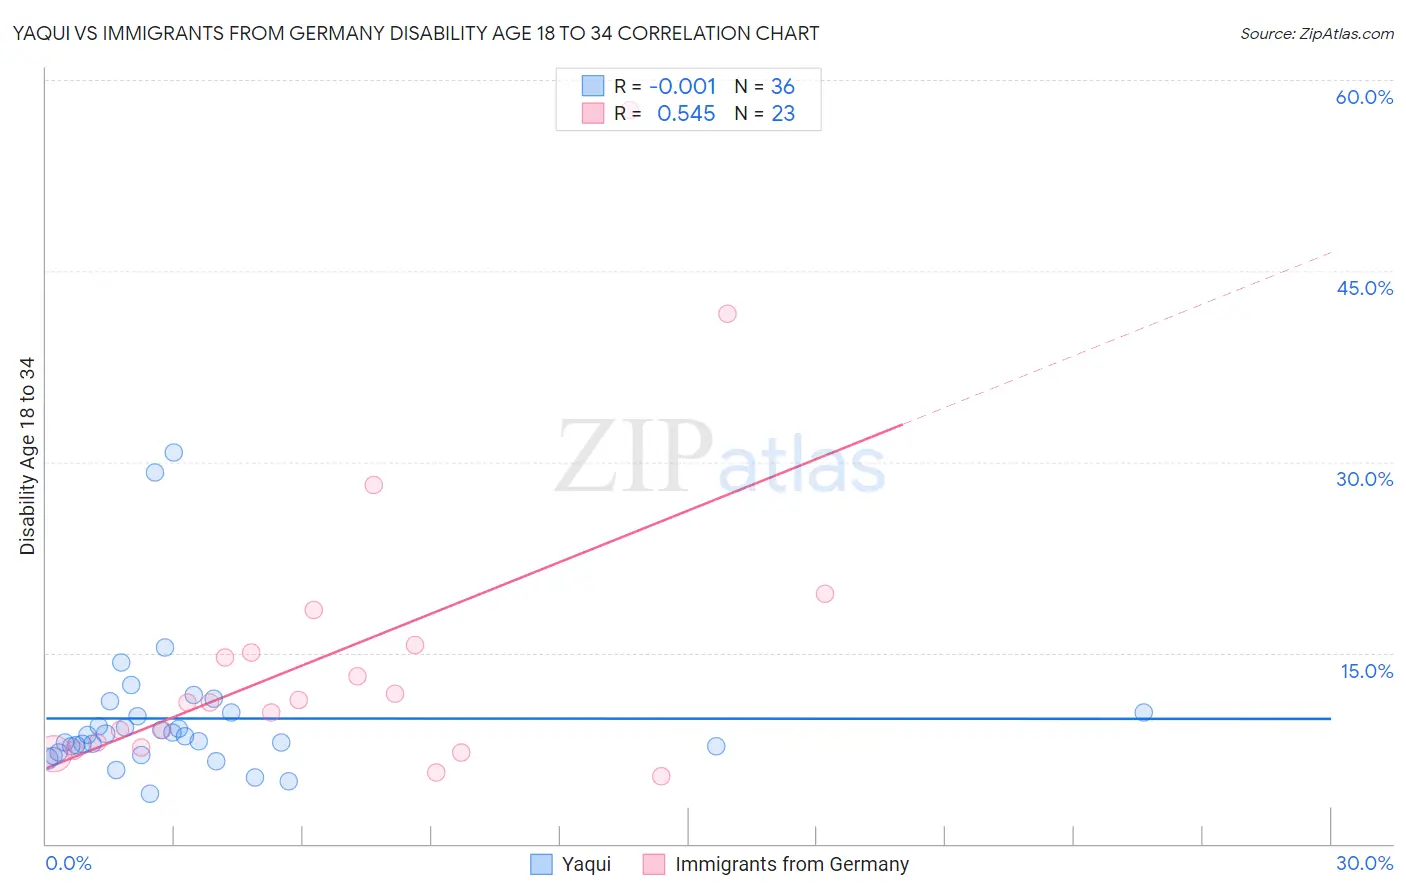
Yaqui vs Immigrants from Germany Disability Age 18 to 34 Correlation Chart
The statistical analysis conducted on geographies consisting of 107,629,449 people shows no correlation between the proportion of Yaqui and percentage of population with a disability between the ages 18 and 35 in the United States with a correlation coefficient (R) of -0.001 and weighted average of 7.4%. Similarly, the statistical analysis conducted on geographies consisting of 462,223,204 people shows a substantial positive correlation between the proportion of Immigrants from Germany and percentage of population with a disability between the ages 18 and 35 in the United States with a correlation coefficient (R) of 0.545 and weighted average of 7.2%, a difference of 2.9%.
Disability Age 18 to 34 Correlation Summary
| Measurement | Yaqui | Immigrants from Germany |
| Minimum | 3.9% | 5.3% |
| Maximum | 30.7% | 57.7% |
| Range | 26.8% | 52.4% |
| Mean | 9.8% | 15.0% |
| Median | 8.5% | 11.1% |
| Interquartile 25% (IQ1) | 7.4% | 7.6% |
| Interquartile 75% (IQ3) | 10.3% | 15.7% |
| Interquartile Range (IQR) | 2.9% | 8.1% |
| Standard Deviation (Sample) | 5.5% | 12.4% |
| Standard Deviation (Population) | 5.4% | 12.1% |
Similar Demographics by Disability Age 18 to 34
Demographics Similar to Yaqui by Disability Age 18 to 34
In terms of disability age 18 to 34, the demographic groups most similar to Yaqui are Czechoslovakian (7.4%, a difference of 0.010%), Lumbee (7.4%, a difference of 0.050%), Immigrants from Portugal (7.4%, a difference of 0.070%), Paiute (7.5%, a difference of 0.48%), and European (7.4%, a difference of 0.51%).
| Demographics | Rating | Rank | Disability Age 18 to 34 |
| Slavs | 0.1 /100 | #273 | Tragic 7.4% |
| Africans | 0.1 /100 | #274 | Tragic 7.4% |
| Immigrants | Somalia | 0.1 /100 | #275 | Tragic 7.4% |
| Europeans | 0.1 /100 | #276 | Tragic 7.4% |
| Immigrants | Portugal | 0.1 /100 | #277 | Tragic 7.4% |
| Lumbee | 0.1 /100 | #278 | Tragic 7.4% |
| Czechoslovakians | 0.1 /100 | #279 | Tragic 7.4% |
| Yaqui | 0.1 /100 | #280 | Tragic 7.4% |
| Paiute | 0.0 /100 | #281 | Tragic 7.5% |
| Spanish | 0.0 /100 | #282 | Tragic 7.5% |
| Danes | 0.0 /100 | #283 | Tragic 7.5% |
| Hopi | 0.0 /100 | #284 | Tragic 7.5% |
| Swedes | 0.0 /100 | #285 | Tragic 7.5% |
| Celtics | 0.0 /100 | #286 | Tragic 7.6% |
| Norwegians | 0.0 /100 | #287 | Tragic 7.6% |
Demographics Similar to Immigrants from Germany by Disability Age 18 to 34
In terms of disability age 18 to 34, the demographic groups most similar to Immigrants from Germany are Indonesian (7.2%, a difference of 0.020%), Immigrants from Laos (7.2%, a difference of 0.030%), Czech (7.2%, a difference of 0.30%), Croatian (7.2%, a difference of 0.31%), and Polish (7.2%, a difference of 0.57%).
| Demographics | Rating | Rank | Disability Age 18 to 34 |
| Guamanians/Chamorros | 0.8 /100 | #248 | Tragic 7.2% |
| Malaysians | 0.7 /100 | #249 | Tragic 7.2% |
| Fijians | 0.6 /100 | #250 | Tragic 7.2% |
| Spaniards | 0.6 /100 | #251 | Tragic 7.2% |
| Poles | 0.6 /100 | #252 | Tragic 7.2% |
| Croatians | 0.5 /100 | #253 | Tragic 7.2% |
| Indonesians | 0.4 /100 | #254 | Tragic 7.2% |
| Immigrants | Germany | 0.4 /100 | #255 | Tragic 7.2% |
| Immigrants | Laos | 0.4 /100 | #256 | Tragic 7.2% |
| Czechs | 0.3 /100 | #257 | Tragic 7.2% |
| Immigrants | Micronesia | 0.3 /100 | #258 | Tragic 7.3% |
| Somalis | 0.2 /100 | #259 | Tragic 7.3% |
| Tohono O'odham | 0.2 /100 | #260 | Tragic 7.3% |
| Northern Europeans | 0.2 /100 | #261 | Tragic 7.3% |
| Canadians | 0.2 /100 | #262 | Tragic 7.3% |