West Indian vs Lebanese Disability Age 18 to 34
COMPARE
West Indian
Lebanese
Disability Age 18 to 34
Disability Age 18 to 34 Comparison
West Indians
Lebanese
6.3%
DISABILITY AGE 18 TO 34
92.0/ 100
METRIC RATING
127th/ 347
METRIC RANK
6.8%
DISABILITY AGE 18 TO 34
13.3/ 100
METRIC RATING
205th/ 347
METRIC RANK
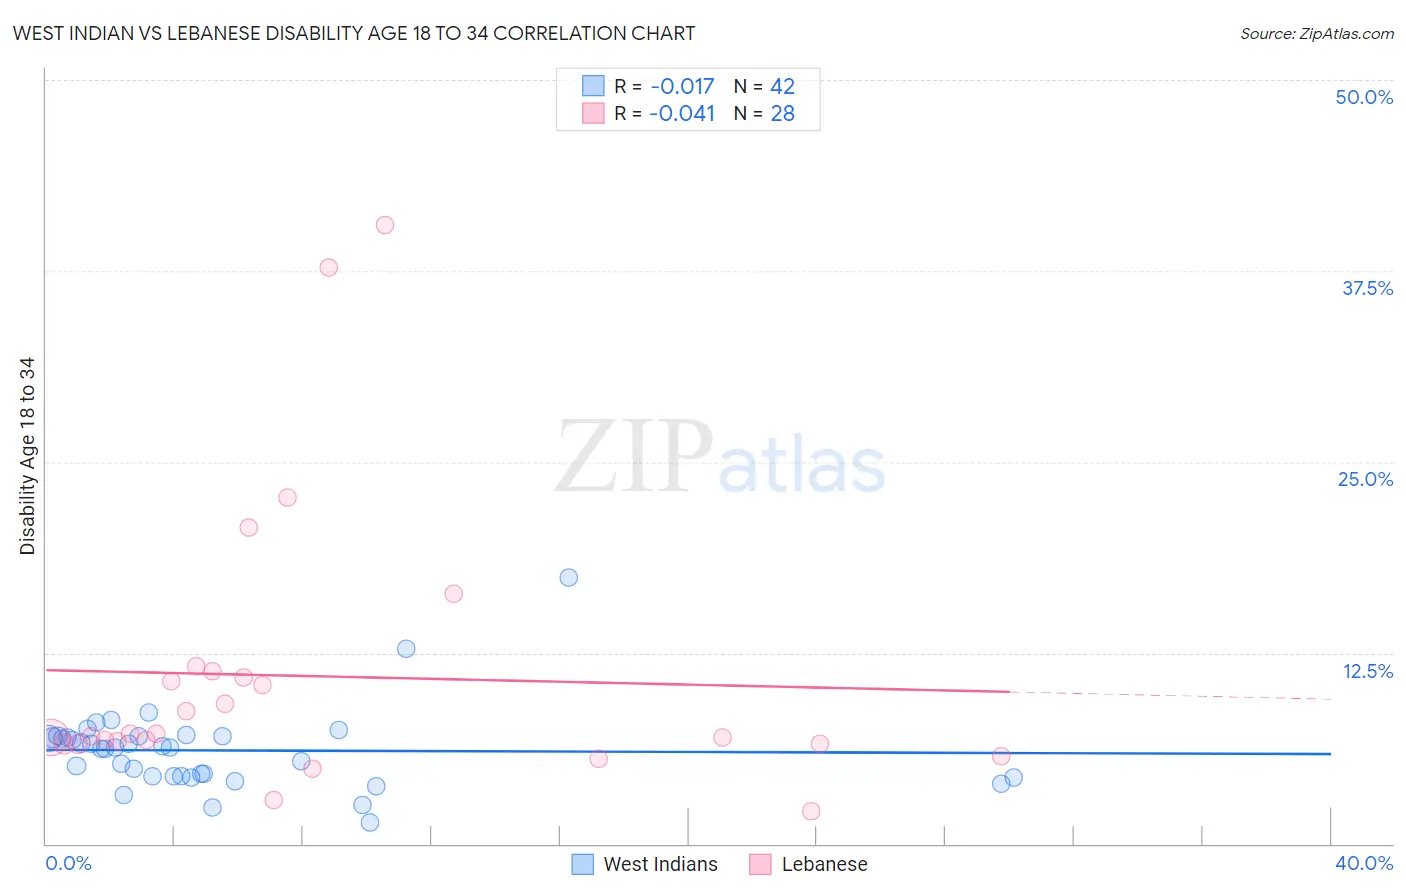
West Indian vs Lebanese Disability Age 18 to 34 Correlation Chart
The statistical analysis conducted on geographies consisting of 253,877,973 people shows no correlation between the proportion of West Indians and percentage of population with a disability between the ages 18 and 35 in the United States with a correlation coefficient (R) of -0.017 and weighted average of 6.3%. Similarly, the statistical analysis conducted on geographies consisting of 400,691,364 people shows no correlation between the proportion of Lebanese and percentage of population with a disability between the ages 18 and 35 in the United States with a correlation coefficient (R) of -0.041 and weighted average of 6.8%, a difference of 7.8%.
Disability Age 18 to 34 Correlation Summary
| Measurement | West Indian | Lebanese |
| Minimum | 1.4% | 2.1% |
| Maximum | 17.4% | 40.5% |
| Range | 16.0% | 38.4% |
| Mean | 6.1% | 11.0% |
| Median | 6.3% | 7.1% |
| Interquartile 25% (IQ1) | 4.4% | 6.6% |
| Interquartile 75% (IQ3) | 7.0% | 11.1% |
| Interquartile Range (IQR) | 2.6% | 4.5% |
| Standard Deviation (Sample) | 2.7% | 9.2% |
| Standard Deviation (Population) | 2.6% | 9.0% |
Similar Demographics by Disability Age 18 to 34
Demographics Similar to West Indians by Disability Age 18 to 34
In terms of disability age 18 to 34, the demographic groups most similar to West Indians are Chinese (6.3%, a difference of 0.010%), Immigrants from Switzerland (6.3%, a difference of 0.14%), Macedonian (6.3%, a difference of 0.16%), Immigrants from Morocco (6.3%, a difference of 0.23%), and Costa Rican (6.3%, a difference of 0.25%).
| Demographics | Rating | Rank | Disability Age 18 to 34 |
| Immigrants | Ukraine | 93.4 /100 | #120 | Exceptional 6.3% |
| Immigrants | Guatemala | 93.4 /100 | #121 | Exceptional 6.3% |
| Immigrants | Czechoslovakia | 93.3 /100 | #122 | Exceptional 6.3% |
| Costa Ricans | 92.9 /100 | #123 | Exceptional 6.3% |
| Immigrants | Morocco | 92.9 /100 | #124 | Exceptional 6.3% |
| Macedonians | 92.6 /100 | #125 | Exceptional 6.3% |
| Immigrants | Switzerland | 92.5 /100 | #126 | Exceptional 6.3% |
| West Indians | 92.0 /100 | #127 | Exceptional 6.3% |
| Chinese | 91.9 /100 | #128 | Exceptional 6.3% |
| Immigrants | Italy | 90.5 /100 | #129 | Exceptional 6.3% |
| Immigrants | Dominica | 90.5 /100 | #130 | Exceptional 6.3% |
| Immigrants | Saudi Arabia | 90.4 /100 | #131 | Exceptional 6.3% |
| Guatemalans | 89.6 /100 | #132 | Excellent 6.4% |
| Brazilians | 89.0 /100 | #133 | Excellent 6.4% |
| Immigrants | Europe | 88.8 /100 | #134 | Excellent 6.4% |
Demographics Similar to Lebanese by Disability Age 18 to 34
In terms of disability age 18 to 34, the demographic groups most similar to Lebanese are Immigrants from Bosnia and Herzegovina (6.8%, a difference of 0.050%), Hispanic or Latino (6.8%, a difference of 0.080%), Japanese (6.8%, a difference of 0.080%), Mexican (6.8%, a difference of 0.11%), and Immigrants from Scotland (6.8%, a difference of 0.13%).
| Demographics | Rating | Rank | Disability Age 18 to 34 |
| Australians | 19.4 /100 | #198 | Poor 6.8% |
| Kenyans | 18.3 /100 | #199 | Poor 6.8% |
| Sierra Leoneans | 17.5 /100 | #200 | Poor 6.8% |
| Greeks | 16.1 /100 | #201 | Poor 6.8% |
| Panamanians | 15.8 /100 | #202 | Poor 6.8% |
| Hispanics or Latinos | 13.8 /100 | #203 | Poor 6.8% |
| Immigrants | Bosnia and Herzegovina | 13.6 /100 | #204 | Poor 6.8% |
| Lebanese | 13.3 /100 | #205 | Poor 6.8% |
| Japanese | 12.8 /100 | #206 | Poor 6.8% |
| Mexicans | 12.6 /100 | #207 | Poor 6.8% |
| Immigrants | Scotland | 12.4 /100 | #208 | Poor 6.8% |
| Immigrants | Burma/Myanmar | 12.3 /100 | #209 | Poor 6.8% |
| Latvians | 11.1 /100 | #210 | Poor 6.8% |
| Immigrants | Norway | 10.0 /100 | #211 | Tragic 6.8% |
| Luxembourgers | 9.4 /100 | #212 | Tragic 6.9% |